
Cameco Corporation (CCJ), Denison Mines Corp. (DNN), enCore Energy Corp. (EU) IsoEnergy Ltd. (ISOU), Centrus Energy Corp. (LEU), NexGen Energy Ltd. (NXE), Uranium Energy Corp. (UEC), Ur-Energy Inc. (URG), Uranium Royalty Corp. (UROY), Energy Fuels Inc. (UUUU)
The upstream uranium industry encompasses uranium exploration, mining, and enrichment, which together produce the nuclear fuel for power reactors. Uranium mining yields uranium oxide concentrate (U₃O₈) – commonly called yellowcake – which is then converted to uranium hexafluoride and enriched to increase the fissile U-235 content for reactor fuel. This segment is critical in the nuclear energy supply chain, providing the raw material that fuels roughly 440 reactors worldwide and underpins ~10% of global electricity generation. Nearly all uranium is used for electricity (with a minor fraction for medical isotopes and naval propulsion). After a decade-long post-Fukushima slump, the industry is now rebounding to meet rising nuclear demand driven by climate goals and energy security needs.
Current supply and demand: Global uranium demand in 2024 was about 67,000 tonnes U per year (≈148 million lbs U₃O₈), exceeding primary mine production (which was ~60,000 t in 2024). The shortfall is bridged by secondary sources (inventories, downblended warheads, reprocessed fuel). For example, production in 2023 was ~165 million lbs versus ~180 million lbs consumed, a 15 million lb deficit made up from stockpiles. This structural deficit emerged after years of low prices that curtailed mine output.
Major producers and concentration: Uranium mining is highly concentrated geographically and corporately. Just 10 mines in 4 countries account for over 60% of world output. Kazakhstan and Canada alone supply the majority: Kazakhstan contributes ~40% of world uranium (mostly via low-cost in-situ leach mines), while Canada’s high-grade Athabasca Basin mines provide ~24%. Namibia, Australia, and Uzbekistan are other key producers. This concentration creates geopolitical risk in supply. For instance, Kazakhstan’s dominance (with about 40% share) and Russia’s role in uranium processing have prompted consumer nations to seek diversified sources. The upstream segment thus sits at a strategic nexus of energy and geopolitics, ensuring fuel supply for nuclear reactors worldwide.
Role of enrichment: After mining, natural uranium (only ~0.7% U-235) must be enriched to ~3–5% U-235 for use in typical reactors. Enrichment (via centrifuges) is often considered a separate mid-stream step, but is part of the upstream fuel cycle for our purposes. Only a few companies (e.g. Urenco, Orano, Tenex, and in the U.S., Centrus) provide enrichment services. Enrichment capacity has historically been ample, but with new reactor designs needing high-assay LEU and potential restrictions on Russian enrichment, this segment is gaining strategic importance. Overall, the uranium upstream industry’s output – uranium concentrate and enriched uranium – is the indispensable first link in the nuclear fuel supply chain, enabling the operation of nuclear power plants around the globe.
🏭 Key Companies
Cameco Corporation (CCJ) – Tier-1 Producer and Integrator
Market Position: Cameco is one of the world’s largest uranium producers and the dominant western-based uranium company. It operates tier-1 mines in Canada’s Athabasca Basin, including McArthur River and Cigar Lake – two of the top-producing uranium mines globally. In 2024, McArthur River/Key Lake produced ~7,808 tU (13% of world mine output) and Cigar Lake ~6,501 tU (11% of world output), illustrating Cameco’s significance. The company also owns 40% of the Inkai ISR mine in Kazakhstan. Cameco has a vertically integrated footprint with uranium refining/conversion capacity and recently expanded into nuclear services. It benefits from large high-grade reserves, low unit costs, and a strong contract book with utilities worldwide.
Recent Strategic Moves: Cameco has pursued a strategy of supply discipline and downstream integration. Notably, it idled capacity during the low-price years and only restarted the McArthur River mine in late 2022 as market conditions improved. This helped tighten supply and positioned Cameco to capture upside as prices rose. On the integration front, in Nov 2023 Cameco (49%) and Brookfield Renewable (51%) acquired Westinghouse Electric, a major nuclear fuel and reactor services company. This transformative deal gives Cameco exposure to reactor fuel fabrication and services, creating a broader “fuel cycle” platform for growth. Cameco has also been aggressively contracting uranium with utilities at higher prices to lock in long-term sales. As of year-end 2024, it had ~220 million lbs in its long-term delivery backlog through 2029 – providing revenue visibility and insulation from spot price volatility. The company’s average realized uranium price in 2024 was $79.70/lb on 33.6 million lbs sold, reflecting strong markets and its contracting success.
Centrus Energy Corp. (LEU) – Advanced Enrichment Specialist
Market Position: Centrus (formerly USEC Inc.) is a U.S.-based nuclear fuel company focused on uranium enrichment and advanced fuels. It is currently the only American company with licensed enrichment capability. Centrus does not mine uranium; instead, it provides enrichment services and is poised to supply High-Assay Low-Enriched Uranium (HALEU) needed for many next-generation reactors. This niche – enrichment to >5% U-235 – positions Centrus as a critical player in future fuel supply for small modular reactors and advanced designs. The company has a long history in enrichment technology (centrifuges) and maintains the only U.S. enrichment plant (the AC100 centrifuge cascade in Ohio) on standby. Centrus also brokers LEU and provides nuclear fuel consulting.
Recent Strategic Moves: Centrus’ key move has been executing a U.S. Department of Energy contract to domestically produce HALEU. In late 2023, Centrus successfully produced an initial 20 kg of HALEU under a DOE demonstration contract – the first U.S. HALEU production in decades. The DOE recently extended Centrus’ contract through 2026 to continue HALEU production and scale up output. This firmly establishes Centrus as a government-backed supplier for advanced reactor fuel. Financially, Centrus has swung to profitability on the back of this contract: it achieved a 22.7% EBITDA margin over the last 12 months and a ROTC of ~10.7% – among the highest in the peer group – thanks to high-value enrichment revenues. The company is also exploring commercial HALEU supply agreements with advanced reactor developers. Centrus’ strategy is to leverage its enrichment technology leadership and government support to capture the emerging HALEU market, while continuing its legacy LEU supply business. This capital-light, service-oriented model has made Centrus one of the most capital-efficient, cash-generative companies in the sector despite its small size.
Denison Mines Corp. (DNN) – Developer of High-Grade Canadian Uranium
Market Position: Denison Mines is a uranium development and exploration company headquartered in Canada. It holds a large portfolio of projects in the Athabasca Basin, including a 95% stake in the Wheeler River Project – host to the high-grade Phoenix and Gryphon uranium deposits. Phoenix, in particular, has extremely high grades (averaging ~19% U₃O₈) and is envisioned as the first in-situ recovery (ISR) mining operation in the Athabasca region. Denison also has a 22.5% ownership in the McClean Lake mill (which currently processes ore from Cigar Lake) and manages uranium exploration across several other properties. While Denison currently has minimal production (and thus negligible revenue), its asset base boasts over 300 million lbs U₃O₈ in resources and significant potential future output if developed.
Recent Strategic Moves: Denison’s strategy is focused on advancing Wheeler River (Phoenix deposit) toward production using innovative mining methods. In 2022, Denison completed a highly successful ISR field test at Phoenix, confirming that uranium-bearing solution could be recovered from the orebody. This de-risked the planned ISR approach in the high-grade deposit. Subsequently, in mid-2023 Denison published a Feasibility Study for Phoenix ISR mining, reporting robust project economics. The company has also consolidated ownership of Wheeler River – increasing its stake to 95% – by acquiring minority partner interests, which gives it greater control over development. On the financing side, Denison in 2021 sold a 2.5% net smelter royalty on Wheeler River to Anglo Pacific for $40.5 million, raising cash for project advancement. More recently, Denison fortified its balance sheet by equity financings to fund environmental permitting and engineering. With the uranium market improving, Denison is positioning to make a construction decision in the next couple of years. It aims to bring Phoenix into production by the late 2020s, targeting initial output of ~6 million lbs U₃O₈ per year.
enCore Energy Corp. (EU) – Emerging U.S. In-Situ Producer via Acquisitions
Market Position: enCore Energy is a U.S.-focused uranium company rapidly growing into a near-term producer through in-situ recovery (ISR) projects. In just a few years, enCore has gone from a junior explorer to controlling multiple fully licensed ISR production facilities in the United States. Its key assets include the Rosita processing plant in South Texas (started production in 2023) and the Alta Mesa ISR central plant in Texas, which it acquired and re-started in 2024. EnCore also holds the advanced Dewey-Burdock ISR project in South Dakota and the Gas Hills project in Wyoming (acquired via its 2022 merger with Azarga Uranium). This portfolio gives enCore one of the largest ISR project pipelines in North America. The company’s strategy is to become a leading domestic uranium producer by sequentially bringing these facilities online.
Recent Strategic Moves: enCore’s growth has been driven by M&A and project restarts. In early 2023, it acquired the Alta Mesa ISR plant and resources from Energy Fuels for $120 million, adding a fully built production center. Alta Mesa had produced ~5 million lbs U₃O₈ between 2005–2013 before being idled due to low prices. EnCore swiftly refurbished Alta Mesa and resumed production there in 2024. In fact, Q4 2024 output at Alta Mesa was 127,293 lbs U₃O₈, making enCore the second-largest uranium producer in the U.S. for that quarter. The company installed a second ion-exchange circuit at Alta Mesa to double its flow capacity and is expanding wellfields to boost output in 2025. Meanwhile, enCore’s Rosita plant in Texas began producing uranium in 2023 and continues to operate. To fund these endeavors, enCore secured a strategic $70 million financing from Boss Energy (an Australian producer) in 2023. The company is also progressing permitting at Dewey-Burdock (final EPA permits received) and plans to develop Gas Hills. In summary, enCore has grown via acquisition of ready-to-produce assets and aggressive project re-starts. This has transitioned the company into an active producer: in 2024 it produced ~0.13M lbs in Q4 alone and expects significantly more in 2025 with Alta Mesa’s expansion. EnCore’s strategic focus is on quickly ramping ISR production across multiple sites to establish itself as a top US uranium supplier.
NexGen Energy Ltd. - Peer with the largest upside
Market position: Its flagship Rook I project in Saskatchewan’s Athabasca Basin – centered on the high-grade Arrow deposit – ranks among the largest undeveloped uranium resources globally. NexGen’s business model is to advance such discoveries through permitting and mine development; Rook I is currently the largest development-stage uranium project in Canada, underscoring the company’s role at the exploration and development end of the uranium value chain.
Due to the Arrow deposit’s scale and exceptionally high grades, NexGen is poised to become a major supplier in the global uranium sector. Rook I is expected to produce roughly 25–30 million pounds - approximately a quarter of current worldwide uranium mine output - while operating at lowest-quartile production costs. This combination of volume and cost position would make NexGen one of the largest and lowest-cost uranium producers once the mine is operational.
Recent Strategic Moves: In recent years, NexGen has made significant strides toward bringing Rook I into production. The company secured provincial environmental approval in 2023 and, as of late 2024, successfully completed the federal technical review process, with final licensing hearings scheduled for 2025–2026. NexGen also finished front-end engineering design (FEED) in mid-2024 and initiated detailed engineering and site preparations, aiming to begin full construction promptly upon receiving final federal approval. In addition, the company signed its first long-term uranium sales contracts in late 2024, agreeing to supply 5 million pounds to major U.S. utilities (approximately 1 million lbs annually from 2029 to 2033). These initial offtake agreements demonstrate market confidence in NexGen’s project and help backstop the financing needed for mine development.
IsoEnergy Ltd. (ISOU) – High-Grade Explorer Turning Producer via Merger
Market Position: IsoEnergy began as a uranium exploration company focused on high-grade discoveries in the Athabasca Basin (Canada). It is known for the 2018 discovery of the Hurricane deposit – a near-surface, very high-grade uranium zone (up to 70% U₃O₈ in drill assays) on its Larocque East property. While exploration remains a core strength, IsoEnergy is now transforming into a development-stage and production-capable company. In late 2024, IsoEnergy announced the acquisition of Anfield Energy, which brings a portfolio of U.S. conventional uranium assets and importantly the Shootaring Canyon Mill in Utah. Shootaring is one of only three licensed uranium mills in the U.S. This merger (expected to close in 2025) significantly expands IsoEnergy’s asset base beyond Canada, giving it near-term production potential in the Western U.S.
Recent Strategic Moves: The planned acquisition of Anfield Energy (AEC) is IsoEnergy’s most notable move. Announced in October 2024, this deal will secure IsoEnergy 100% ownership of the Shootaring Canyon Mill plus Anfield’s conventional uranium/vanadium projects in Utah, Colorado, and Arizona. The strategic rationale is to create a “multi-asset uranium producer” with a combined U.S. project portfolio that can feed Shootaring (which is being permitted for a throughput increase to 1,000 tpd and 3M lbs U₃O₈ annual capacity). The merger expands IsoEnergy’s resource base by +157% (to 17.0 Mlbs M&I in the U.S.) and positions the company among the largest uranium holders in the U.S. Even ahead of the merger, IsoEnergy signaled its production ambitions by restarting work at the past-producing Tony M Mine in Utah (one of Anfield’s assets). In May 2025, IsoEnergy (traded as ISOU on NYSE) launched programs to evaluate and advance the Tony M uranium mine, which had operated in the 1970s–80s. This is a pivot from pure exploration to re-developing brownfield mines. Concurrently, IsoEnergy continues advancing its high-grade Hurricane deposit toward economic studies, and it raised ~$15M in 2023 to support exploration and development. In summary, IsoEnergy’s recent strategy is a bold pivot from explorer to producer: by acquiring Anfield, it gains near-term production capability in the U.S. (with a mill and permitted mines) while retaining upside from its Canadian high-grade projects. This diversification aims to make IsoEnergy a future mid-tier uranium producer spanning multiple jurisdictions.
Uranium Energy Corp. (UEC) – Aggressive Consolidator with ISR & Conventional Projects
Market Position: Uranium Energy Corp is a U.S.-based uranium company that has pursued an aggressive growth-by-acquisition strategy, assembling a broad portfolio of production-ready and development assets across the United States, Canada, and Paraguay. UEC’s core holdings include ISR operations in South Texas (the Palangana mine and Hobson processing plant, Burke Hollow development) and in Wyoming (the Reno Creek project, and recently restarted operations at Christensen Ranch/Irigaray). UEC has also acquired significant conventional project assets – notably, it acquired Uranium One Americas’ U.S. in-situ assets in 2021 and bought Canada’s UEX Corporation in 2022, which brought a suite of Athabasca Basin projects. Through UEX, UEC obtained 100% of the advanced Roughrider deposit (an Eastern Athabasca development project acquired from Rio Tinto) and minority stakes in other Canadian deposits. As a result, UEC now touts one of the largest resource bases among junior uranium companies, with diversified projects ranging from near-term ISR production in the U.S. to longer-term high-grade projects in Canada. The company has also stockpiled physical uranium (over 1 million lbs) as a strategic reserve.
Recent Strategic Moves: UEC’s strategy has been characterized by serial acquisitions and project restarts:
In 2021, UEC purchased Uranium One’s entire U.S. asset portfolio (including the Christensen Ranch/Irigaray ISR processing plant and licensed Wyoming resources). This instantly expanded UEC’s production capability in Wyoming.
In mid-2022, UEC outbid competitors to acquire UEX Corporation, doubling UEC’s resources and giving it stakes in multiple Canadian deposits. Notably, Roughrider is a world-class deposit (17.2 Mlbs @ 4.0% U₃O₈ indicated) that UEC is now advancing; a preliminary economic assessment in 2023 showed it could be a top-tier underground mine.
UEC completed the Roughrider acquisition from Rio Tinto in Oct 2022 for $150 million, consolidating 100% ownership.
Operationally, UEC resumed ISR production in 2023–24. In South Texas, it maintained Palangana on standby (and built a uranium inventory by buying in the spot market). In Wyoming, UEC restarted the Christensen Ranch ISR wellfield in August 2024 (first production there since 2018), and by early 2025 it had drummed its first pounds from this restart. UEC is now ramping up wellfield flow rates and could become a producer in 2025. It also received its final permits for the Burke Hollow ISR project in Texas, positioning that for future output.
To fund these moves, UEC has leveraged its strong market capitalization to raise capital (it raised over $250M in 2021–22). Notably, UEC strategically held a physical uranium inventory (2.3 Mlbs at one point) which it has used to monetize gains or collateralize deals – a different tactic than most peers.
Ur‐Energy Inc. (URG) – Established Small Producer with ISR Operations in Wyoming
Market Position: Ur‑Energy is a U.S. uranium mining company operating in Wyoming. It is among the few American firms that achieved commercial production in the 2010s. Ur‑Energy’s flagship asset is the Lost Creek ISR mine and plant, which began production in 2013. Lost Creek has licensed capacity of ~2 million lbs U₃O₈ per year, though it operated at reduced rates and was idled during the low-price period. Ur‑Energy also fully permits the Shirley Basin ISR project (Wyoming), a near-term development expected online by 2026. Shirley Basin was a past-producing district now being advanced with modern ISR methods. Ur‑Energy’s resources are more modest than some peers (~11.9 Mlbs proven & probable at Lost Creek, 8.8 Mlbs P&P at Shirley Basin), but it has the advantage of fully constructed and permitted processing infrastructure at Lost Creek. Overall, Ur‑Energy is positioned as a low-volume but flexible producer, focused on U.S. domestic supply.
Recent Strategic Moves: After weathering several years of minimal activity, Ur‑Energy is now ramping up production in response to higher prices and new contracts:
In 2021–2022, Ur‑Energy kept Lost Creek on care-and-maintenance (and reported zero uranium sales in those years) to conserve resources while prices were low. It used this time to optimize wellfields and cut costs.
In late 2022, with uranium markets improving, Ur‑Energy secured multiple long-term contracts with U.S. utilities. As of 2023, it had seven contracts for deliveries totaling 440,000–1,300,000 lbs U₃O₈ annually from 2025–2030. This base of committed sales gave Ur‑Energy confidence to restart mining.
The company resumed production at Lost Creek in Q2 2023. By 2024, it produced 570,000 lbs (0.57 Mlbs) and generated $33.7M revenue from sales – a dramatic rebound from nil production previously. In fact, Ur‑Energy was the largest uranium producer in the U.S. for full-year 2024 (despite being surpassed by others in Q4 output).
Ur‑Energy also participated in the U.S. government’s Uranium Reserve program: in 2023 it sold 280,000 lbs to the DOE for ~$18M. These government purchases (at ~$64/lb) provided a timely cash infusion.
On the expansion front, Ur‑Energy commenced construction at Shirley Basin in 2023. Shirley Basin is expected to begin production by January 2026 and will add ~0.8–1.0 Mlbs/year of capacity (an ~83% increase in company-wide licensed output). This project has a shorter mine life but very low-cost, shallow ore.
To strengthen its balance sheet, Ur‑Energy raised ~$45M equity in 2023 and paid down debt. It entered 2025 with ample cash to fund the Shirley Basin build-out.
Uranium Royalty Corp. (UROY) – Royalty & Streaming Play on Uranium Assets
Market Position: Uranium Royalty Corp (URC) is the only pure-play uranium royalty and streaming company. Rather than mining directly, URC provides financing to uranium mine developers/operators in exchange for royalties (a percentage of production or revenue) or streams (rights to purchase a portion of production at a fixed price). URC has assembled a portfolio of interests in several prominent uranium projects: e.g. a 1.97% NSR royalty on the McArthur River mine (Canada), 3.0% NSR on Cigar Lake (Canada) via a holding, 7.5% gross revenue royalty on Langer Heinrich (Namibia), and various royalties on development projects in the U.S. (Dewey-Burdock, Lance) and elsewhere. The company also holds physical uranium inventory (over 1.5 million lbs U₃O₈) and equity stakes in uranium companies. Uranium Royalty’s model offers investors exposure to uranium price upside and project success without direct operating risks or costs – making it akin to royalty companies in gold or oil.
Recent Strategic Moves: Uranium Royalty Corp has been actively deploying capital into royalties, strategic equity, and physical uranium:
It has acquired royalties on several producing mines. In 2022, URC purchased a portfolio of royalties from Rio Tinto, including the McArthur River royalty, for ~$26M. As McArthur resumed production in 2022–2024, URC began receiving royalty revenue from this top-tier mine. Similarly, with Paladin’s Langer Heinrich mine restarting in 2024, URC’s royalty on that asset will start generating cash flow.
URC built up a significant physical uranium inventory at attractive prices. It bought ~1.4 million lbs U₃O₈ in 2021–2022 at an average ~$42/lb. In fiscal 2023, as prices rose, URC opportunistically sold a portion (300,000 lbs) of its inventory at ~$50–$60/lb, realizing a profit and bolstering its cash. This contributed to URC’s revenue in that period. However, such sales are one-off in nature.
The company raised $25M in mid-2023 via equity to fund further royalty acquisitions and maintain a strong treasury for new deals. It also increased its stake in Yellow Cake plc (a London-listed physical uranium holding company), enhancing its indirect uranium exposure.
Uranium Royalty’s strategy is to continue adding royalties on high-quality projects. It announced in 2023 a new royalty on the Dawn Lake project (Saskatchewan) and is eyeing other investments, benefiting from its insider relationships (it has close ties to NexGen and other developers via shared major shareholders).
Financially, URC’s revenues have been relatively small (FY2024 revenue ~$7M, largely from uranium sales and interest). The volatility of its income is notable – for instance, after a one-time uranium sale boosted 2024 revenue, analysts forecast a ~71% drop in revenue for 2025 since fewer transactions/royalty payments are scheduled. Despite negative net earnings (common for a growth-stage royalty firm), URC’s free cash flow margin has been positive (about +44% LTM) because its operating expenses are low and it can generate cash by liquidating uranium inventory.
Energy Fuels Inc. (UUUU) – U.S. Uranium Producer Diversifying into Rare Earths
Market Position: Energy Fuels is a unique player in that it is the leading U.S. producer of conventional (hard-rock) uranium and has recently diversified into rare earth element (REE) processing. The company owns the White Mesa Mill in Utah, which is the only operating conventional uranium mill in the United States. This mill gives Energy Fuels the ability to process uranium ore from its own mines and alternate feeds (materials like cleanup wastes and mineral sands). Energy Fuels holds a portfolio of uranium mines primarily in the Four Corners region (Utah/Arizona/Colorado), including Pinyon Plain (Arizona), La Sal Complex (Utah), and Whirlwind & others (Colorado), mostly on standby during low uranium prices. It also has significant vanadium resources (a vanadium processing circuit at White Mesa) and began processing monazite sands at White Mesa in 2021 to produce a mixed REE carbonate – positioning itself in the critical minerals supply chain. Energy Fuels thus has a multi-commodity portfolio, but uranium remains a core focus, especially as it typically contributes the bulk of revenue when in production.
Recent Strategic Moves: Energy Fuels’ strategy in recent years has been two-pronged: restart uranium production as markets improve, and invest in rare earth processing capability for additional revenue streams:
Restarting Uranium Mining: In 2022–2023, with rising prices, Energy Fuels reopened some of its mines. It resumed mining at the Pinyon Plain mine (formerly Canyon mine) in Arizona in 2022, stockpiling high-grade ore. It also restarted operations at its La Sal and Pandora mines in Utah to generate feed for White Mesa. By late 2024, Energy Fuels was actively processing these ores: in Q4 2024, it produced 157,525 lbs U₃O₈ at White Mesa, making it the top U.S. producer for that quarter. For full-year 2024, Energy Fuels was the third-largest U.S. uranium producer (after Ur‑Energy and enCore) with ~0.16 Mlbs, all produced in Q4. The company is also preparing its Nichols Ranch ISR project (Wyoming) for potential restart within ~12 months if market conditions warrant, signaling readiness to further boost production.
Rare Earth Initiatives: In a notable pivot, Energy Fuels entered the rare earth elements arena. It struck a deal with Chemours to acquire and process monazite sands (which contain uranium and rare earths). Since 2021, White Mesa Mill has been processing monazite ore from Georgia to extract uranium (a by-product) and produce a mixed rare earth carbonate. In 2022, Energy Fuels acquired the Alta Mesa heavy mineral sand project in Brazil (from vendor Ionic Sands, often referred to as acquiring assets from Base Resources) to secure monazite supply. In 2024, REE processing contributed significantly: the company sold ~$16.9M of REE carbonate in Q1 2025. It is working to install separation circuits to move further down the REE value chain (aiming to produce separated oxides in the future). This diversification is part of a U.S. government-backed effort to establish domestic REE capabilities and has garnered Energy Fuels some DOE funding and contracts.
Financial moves: Energy Fuels took advantage of high vanadium prices in 2018–2019 to sell vanadium inventory and bolster cash. More recently, it raised ~$88M in equity in 2021 to fund rare earth and uranium project developments. It also sold its non-core Alta Mesa ISR project to enCore for $120M in 2023, monetizing an asset that was idle and using proceeds to focus on its core (this sale ironically helped enCore become a producer).
The net result of these moves is that Energy Fuels has evolved into a multifaceted company. It can generate revenue from uranium, vanadium, and rare earths, which gives it flexibility but also introduces earnings volatility.
🤼 Competitor Strategy Comparison – Current Tactics and Differences
The above companies employ a range of strategies in the upstream uranium sector, shaped by their asset profiles and corporate objectives. A comparison of their current strategies highlights several distinct approaches:
Large Producer vs. Junior Developer: Cameco represents the large, established producer strategy – it practices production discipline and long-term contracting. Cameco carefully matches output to contracts and even held back production during the glut years, preserving asset value. Its focus now is on securing long-term supply agreements (220 Mlbs contracted through 2029) and expanding vertically (e.g. via Westinghouse acquisition) to offer full fuel services. In contrast, most juniors (e.g. NexGen, Denison, IsoEnergy) are still in project development mode – they prioritize permitting, feasibility studies, and strategic partnerships/financing to eventually bring their first mines online. These developers typically do not hedge or contract much yet, preferring to keep future production uncommitted to ride expected price increases. Their tactical focus is on de-risking projects (e.g. Denison’s ISR field tests) and securing funding (NexGen’s large strategic investment from Asia, etc.) to achieve construction.
Growth by Acquisition vs. Organic Growth: Several mid-tier companies are pursuing growth-through-acquisition strategies. Uranium Energy Corp (UEC) and enCore Energy exemplify this by rapidly buying up assets to scale their resource base and production capacity. UEC acquired entire portfolios (Uranium One, UEX) to become a one-stop shop with multiple projects, and enCore bought Alta Mesa and Azarga’s assets to quickly become a producer. This contrasts with an organic growth strategy seen at companies like Ur-Energy or historically Cameco – Ur-Energy largely stuck to developing its own Lost Creek and Shirley Basin, expanding stepwise as market signals turned positive. The acquisitive companies aim for fast-track growth, banking on readily deployable assets to leapfrog into production, whereas organic growers tend to be more cautious, scaling output gradually in line with contract cover or price floors.
U.S. Domestic Focus vs. International Diversification: Energy Fuels, Ur-Energy, enCore, UEC all emphasize a U.S. production revival, leveraging increasing U.S. government support (uranium reserve purchases, potential import tariffs, etc.) to justify restarts. Their tactics include engaging in U.S. federal initiatives (e.g. Ur-Energy and Energy Fuels sold into the U.S. Uranium Reserve at premium prices) and highlighting “America-first” supply security in investor messaging. In contrast, Cameco and NexGen (Canada-focused) or those with international portfolios (UEC with Canadian projects, Uranium Royalty with global royalties) are more globally diversified in outlook. They target utility customers worldwide and may not rely on any single country’s policy. For example, Cameco’s contracts span Asia, Europe, Americas, and it formed a JV with a UK firm (Brookfield) for Westinghouse to globalize its services. Meanwhile, U.S.-centric players like enCore and Ur-Energy timed their production restarts partly on favorable U.S. policy signals (fast-tracked permitting, etc.) and are tailoring growth to meet potential U.S. utility demand surges (e.g. data center energy needs driving U.S. uranium consumption).
Contracting and Market Exposure: Strategy also diverges on market approach. Cameco and Ur-Energy favor long-term contracts to ensure stable cash flow and fund operations – Cameco’s backlog insulates it from short-term price swings, and Ur-Energy signed multi-year deals before ramping Lost Creek. In contrast, some peers have been more spot-exposed or speculative. For instance, Energy Fuels and Ur-Energy withheld sales in years of low prices and sat on inventory, waiting for higher spot prices. This opportunistic approach can yield higher prices for their product when the market improves, but also means absorbing holding costs and operational shutdowns during downturns. Similarly, developers like NexGen/Denison have no contracts yet – implicitly a bet on future higher spot/term prices (they intend to secure contracts closer to production). Uranium Royalty Corp’s strategy is purely a leveraged price exposure play – it buys physical uranium and royalties instead of engaging in contracts, to maximize upside when uranium prices rise. Each approach balances risk differently: contract-heavy strategies trade some upside for certainty (suitable for large producers needing stable revenue), while spot-exposed strategies aim to capture maximum upside at the cost of near-term volatility.
Technology and Niche Focus: A unique strategic differentiator is technological niche:
Centrus stands out by focusing on enrichment technology (HALEU) rather than competing in mining. Its tactic is to align with government programs (DOE HALEU contract) and position itself as an indispensable supplier in the advanced reactor supply chain. This contrasts with all the miners who are competing in the arena of finding and extracting U₃O₈. Centrus essentially sidesteps the mining rush and instead bets on a niche where it has limited competition (Western enrichment capacity) – a very different competitive arena than the mining-focused companies.
Energy Fuels carved a niche in critical minerals diversification – it uses its existing infrastructure for rare earth processing, giving it a second revenue stream distinct from pure uranium mining. This tactical pivot aims to utilize its mill year-round (processing monazite for REEs even when uranium ore supply is low) and to leverage U.S. government support for rare earth independence. No other peer in this list has entered the rare earth market; it’s a differentiator for Energy Fuels but also means managing two commodity markets (with different dynamics) under one roof, which can be challenging.
📈 Historical and Forecast Growth Performance
The past five years have seen starkly different revenue trajectories among these companies, largely reflecting their operational status (producer vs. developer) and market conditions. Broadly, companies that resumed or began production during the uranium price upswing have demonstrated explosive revenue growth, while those still in pre-production or idled saw flat or declining revenues:
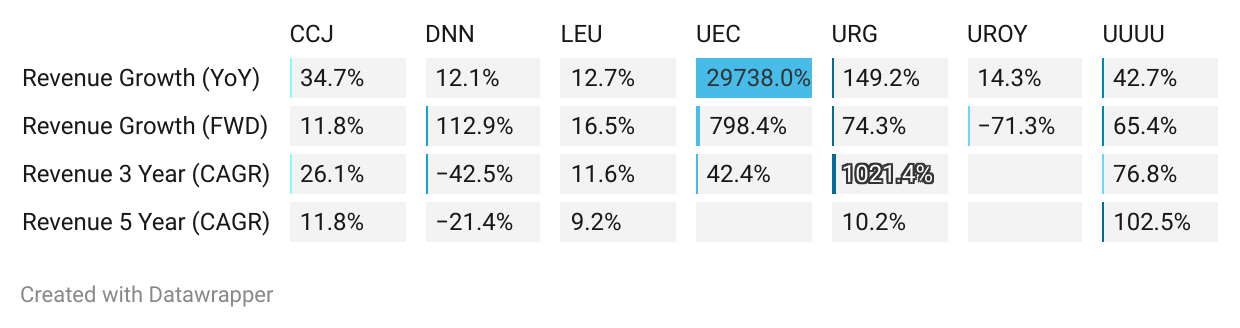
Leaders in past 5-year growth: Energy Fuels and Uranium Energy Corp stand out for extraordinary percentage growth (albeit from tiny bases). Energy Fuels’ revenue rocketed from just $3 million in 2021 (when it made no uranium sales) to over $78 million in 2024. This equates to a 5-year CAGR over 100% and ~26x increase, driven by the company’s re-entry into production and new rare earth sales. Uranium Energy Corp similarly went from essentially zero mining revenue (it had been idle, focusing on acquisitions) to tens of millions in sales after 2022–2023 as it sold inventory and restarted wellfields – a year-on-year growth of 29,738% was recorded in the last year alone. Ur‑Energy also showed high growth: after no sales for years, it recorded $33.7M revenue in 2024 by selling 570,000 lbs, up from $0 in 2021–2022, which yields an astronomical CAGR (Ur‑Energy’s 3-year revenue CAGR is over 1000%). Essentially, any company that went from 0 to active production exhibits huge percentage gains.
Middle-of-pack growth: Cameco achieved solid growth on an already large base. From 2019 to 2024, Cameco’s revenue grew at roughly 11.8% CAGR. Notably, from 2021 to 2024, it accelerated to ~24.8% CAGR as it brought McArthur River back online and uranium prices rose. In fact, Cameco’s 2025 revenue is forecast around C$3.3–3.55 billion, which would be ~30% CAGR over 2021–2025 – a robust growth trajectory for a major producer. Centrus Energy’s revenue grew around 9–12% annually in recent years, reflecting its steady but niche enrichment services (with a bump in 2023 due to the HALEU contract). Uranium Royalty Corp saw modest revenue growth (from small royalty and trading income) – one dataset showed +14% y/y – but its revenue levels remain low and irregular.
Laggards in past growth: Development-stage companies without production unsurprisingly had negligible or negative revenue growth. Denison Mines, for example, saw a decline in its small revenues (derived from toll milling and management fees) – its 5-year revenue CAGR was about -21%. IsoEnergy and NexGen have essentially no revenue in this period (only interest income or minor option payments), so they don’t register meaningful growth. These firms were effectively in R&D mode, not generating operating income yet, hence “growth” in the conventional sense doesn’t apply until they begin production. Anfield Energy likewise had no revenue and remained at zero.
Expected revenue growth (2025–2030): Over the next five years, the consensus expectation is that as new projects come online, many of these companies will transition from zero revenue to substantial sales, making them the growth leaders, while established players grow more moderately. Key projections and assumptions include:
High future growth potential (developers turning producers): Companies like NexGen and Denison are poised for transformational revenue growth once their flagship mines commence production (targeting around 2027–2028 for NexGen’s Arrow and ~2026–2027 for Denison’s Phoenix). For example, NexGen’s Rook I (Arrow) is forecast to produce ~25–30 Mlbs annually at peak – nearly a quarter of current world demand – which would propel NexGen’s revenue from $0 to perhaps ~$1.5–2 billion/year (if uranium prices ~$60–$70/lb). That is effectively infinite percentage growth from today. Denison, with a smaller Phoenix ISR operation (~6 Mlbs/year planned), could likewise see revenue jump from near $0 to hundreds of millions annually post-2026. The market views these as high-upside, high-growth companies, but that growth is back-end loaded (late this decade). Even in the near-term, early revenue trickles may start: Denison, for instance, is expected to more than double its revenue in 2025 (+113% y/y) as it potentially sells some of its produced resin from ISR field tests or receives one-time payments. But those initial revenues are tiny – the real surge awaits full production.
Steady growth for current producers: Cameco is expected to continue growing but at a more moderate pace now that its main capacity is online. Analysts project Cameco’s revenue will rise ~11% in 2025 and the company itself forecasts ~4–5% annual volume growth through 2028 (with McArthur River at full rate and potential incremental increases). If uranium prices continue climbing, Cameco’s top-line could grow faster (since many of its contracts are market-linked). But relative to the triple-digit bursts of smaller players, Cameco will likely see low-double-digit annual growth – still industry-leading in absolute dollar terms, but not in percentage. Centrus Energy should see healthy growth (~16% in forward 1-year revenue as it expands HALEU production under the extended DOE contract. Its five-year growth will depend on commercial HALEU demand; if advanced reactors proceed, Centrus could scale its cascade (with DOE cost-sharing) and significantly increase revenue by 2026–2030. For now, a mid-teens annual growth rate is anticipated for Centrus – solid but not explosive.
Ramping juniors to lead near-term % growth: In the immediate next 1–2 years, U.S. ISR producers like UEC, enCore, Ur-Energy are set to deliver some of the highest percentage revenue growth as they ramp up output from a small base:
Uranium Energy Corp’s revenue is projected to jump ~813% in the next year, reflecting that it will likely move from sporadic sales to steady contract deliveries (especially if it begins selling from its Wyoming operations and newly acquired inventories). Over a five-year span, UEC could become a mid-tier producer with multiple millions of pounds sold annually, implying continued high CAGR (though the initial spike is largest).
enCore Energy, having just begun production in 2023–24, should also see multi-fold revenue increases. Its Alta Mesa plant is scaling up (doubling flow capacity), and the company could add Dewey-Burdock output before 2030. We could see enCore’s annual revenue grow from a few million in 2024 to perhaps >$50M by 2026 and higher beyond – a very high CAGR. (Specific consensus figures are not widely available due to its early stage, but clearly the growth trajectory is steep.)
Ur‑Energy, thanks to its new contracts, will likely roughly double its revenue in 2025 (+74% y/y forecast) and continue growing as it adds Shirley Basin’s output by 2026. Having sold ~$33M in 2024, Ur‑Energy’s annual sales could increase to ~$50–60M in a couple years, then possibly ~$80M+ once Shirley Basin is at capacity, representing strong growth (though not as extreme as those starting from zero).
Energy Fuels might see sizable growth as well, albeit with more volatility. After a big jump in 2024, 2025 could see another ~65% revenue increase if it sells more uranium and rare earth carbonate at full-year capacity. Longer-term, if it succeeds in separating rare earths, that could add entirely new revenue lines by 2026–2027. However, because its 2024 base is already higher, the CAGR may moderate compared to the initial jump (e.g. 2021–2024 was exceptional >100% CAGR, 2024–2028 might be more in the 15–25% range annually as operations normalize).
Possible laggards forward: Interestingly, Uranium Royalty Corp may see negative revenue growth in the immediate term. As noted, URC had an outsized revenue in one year from a big uranium sale; with no repeat, its FY2025 revenue is expected to drop ~71%. Over five years, URC’s growth depends on new royalty streams kicking in (e.g. Langer Heinrich royalty from 2024, McArthur River ramp-up). It could see uneven jumps rather than a steady CAGR – lumpy growth tied to project schedules. Companies that remain stuck in permitting or funding challenges might also lag: if, say, a developer fails to advance and remains non-producing by 2030, its revenue will still be negligible. An example could be IsoEnergy if the Anfield assets take longer to restart – it may not generate significant revenue for a few years, making it a growth laggard relative to peers who are already selling product.
🌐 Market Size Estimation: Bear, Base, and Bull Scenarios
Estimating the global uranium upstream market size (in USD) under different scenarios requires assumptions about future uranium demand (volume) and price. Below we outline bear, base, and bull cases with credible sources and reasoning for each:
Bear Case: Low nuclear growth, ample supply – a subdued market. In a bear scenario, nuclear power expansion slows (due to policy setbacks or competition from other energy), and supply is relatively abundant (e.g. idle mines restart easily, secondary supplies remain significant). The World Nuclear Association (WNA) Lower Scenario projects global reactor requirements of only ~107,000 tU by 2040, which is modest growth from ~68,000 tU today. In this case, annual uranium demand might hover around 70,000–80,000 tU through the late 2020s (approximately 155–175 million lbs U₃O₈). With adequate supply, uranium prices could revert to the marginal cost of production. Many analysts cite $40–50/lb as the incentive price for lower-cost projects in oversupplied conditions. For instance, in the mid-2010s bear market, prices fell to ~$20–25/lb, well below sustainable levels, before recovering. In a bear case we assume price stabilizes around $50/lb (enough to keep most existing mines running but little new investment – akin to long-term post-Fukushima lows). Market size calculation: ~165 million lbs/year * $50 = $8.3 billion per year. This would be the rough magnitude in the late 2020s if demand stagnated and prices stayed soft. For a slightly longer-term perspective, using the WNA Lower Scenario 2040 figures: 107,000 tU (~236 million lbs). At $50/lb, that yields ~$11.8 billion annual market size. Thus, bear case market size ≈ $8–12 billion/year (order of magnitude). In this environment, the market value remains similar to or below current levels (today’s market is ~$9–10B at ~150M lbs * $60–$65).
Base Case: Steady growth – tight but balanced market. In the base case, global nuclear capacity grows as currently planned and some new builds occur for climate goals, leading to moderate demand growth, while mining output increases but struggles to fully keep pace initially. The WNA Reference Scenario (2023 report) forecasts uranium requirements rising to ~150,000 tU by 2040 (a ~2.2x increase from 2024). By 2030, WNA projects about 87,000 tU (~191 million lbs) demand – ~28% above 2024 levels. This implies a CAGR of ~4–5% in demand, consistent with many analyses (WNA raised its demand CAGR forecast to 5.3% through 2040). In a base scenario, the market moves into a mild structural deficit (demand > primary supply), which supports higher prices in real terms, but new mines are gradually built to prevent extreme shortages. We might assume long-term contract prices in the $70–$80/lb range – enough to incentivize new production (though some experts argue $80+ is needed for many greenfield projects). Indeed, by mid-2025, term prices have firmed around $70–$80 and spot around $60–$65. For a base case calculation, take ~200 million lbs/year demand at ~$75/lb as a mid/late-2020s average. Market size = 200M lbs * $75 = $15 billion/year. This aligns with other estimates: DataM Intelligence reports the uranium market was ~$9.3B in 2024 and will reach ~$13.6B by 2032 under a moderate growth outlook (implying mid-$70s pricing given volumes). By 2040, using WNA’s 150,000 tU (~330M lbs) and a perhaps slightly higher price of ~$80, the market would be ~$26 billion. To be conservative, we can say base case ~ $15–25 billion annually in the 2030s, with mid/late-2020s around the lower end of that range (low teens in $billions).
Bull Case: Nuclear renaissance – undersupply drives a booming market. The bull scenario envisions rapid nuclear power expansion (far exceeding current plans) coupled with supply shortfalls due to years of underinvestment and possible geopolitical supply disruptions. The WNA Upper Scenario sees uranium demand exceeding 204,000 tU by 2040. The IAEA similarly has a high case of ~100,000 tU/year by 2040 (nearly double current levels), which implies ~4–5% annual growth sustained over two decades. In a bull case, by the early 2030s demand could easily surpass 100,000 tU (~220 million lbs) annually. Supply would struggle to ramp up – many new mines would be required, and any delays or shortfalls could lead to a prolonged supply deficit. This is the scenario where uranium prices spike to incentive levels and beyond. For instance, Citi’s bull-case forecast (as of Sep 2025) has uranium reaching $125/lb in the near term. In a sustained bull market, prices could remain well above $100 if shortages persist. A conceivable bull scenario by ~2030: demand ~230–250 million lbs, and price in the $100–$120/lb range. Market size = 240M lbs * $110 ≈ $26.4 billion/year. If the tightness is extreme (some predict possible spikes to $150+ if utilities scramble), the market value could temporarily exceed $30–40B, but using a more sustainable high price: e.g. at WNA Upper 2040 demand of ~450M lbs, even at $100/lb, that’s $45 billion annually. For an upper-bound, using Citi’s $125/lb and ~450M lbs (assuming nuclear growth truly accelerates to meet climate goals), yields ~$56 billion. Realistically, a bull case through 2030s might see the market size doubling or tripling from current levels. We can bracket bull case as $25–50 billion per year in the 2030 timeframe (with the lower end assuming just moderately higher prices around $90–100 and some volume growth, and the upper end assuming both strong volume and price well into triple digits).
📊 Major Industry Trends and Growth Drivers
Several powerful trends and long-term drivers are shaping the global uranium upstream industry. These trends underpin optimistic demand forecasts and are driving strategic shifts among companies and governments:
Resurgence of Nuclear Energy for Climate and Energy Security: After a post-2011 lull, nuclear power is experiencing a policy and public opinion turnaround. Governments worldwide are prioritizing nuclear for decarbonization and energy security, which directly boosts uranium demand. At COP28 (2023), 20+ countries (including the U.S.) committed to tripling nuclear capacity by 2050 as part of climate action. Major economies like China, India, and the U.S. have ambitious reactor build programs, while countries that once planned phase-outs (Japan, South Korea, France) have extended reactor lifetimes or added new projects. The result is an expected 28% surge in uranium demand by 2030 and more than doubling by 2040 under WNA’s latest outlook. This growth is a structural driver: more reactors (and life extensions) mean higher baseline uranium requirements for decades. Climate change objectives (net-zero pledges) are giving nuclear a prominent role due to its low carbon footprint, and geopolitical tensions (e.g. reliance on Russian gas) have underscored nuclear’s value for energy independence. This has led to stronger political support and new government initiatives: e.g. the U.S. ADVANCE Act streamlining reactor licensing, France reversing course to build new reactors, the EU including nuclear in its green taxonomy, etc. In sum, a broad pro-nuclear policy environment is a key trend driving a structural upswing in uranium demand long-term.
Small Modular Reactors (SMRs) and Advanced Reactors: Technological innovation in reactor design is another growth vector. SMRs and advanced reactors are moving from concept to reality, promising to open new markets and applications for nuclear. These smaller units (typically <300 MWe) feature lower upfront costs, factory fabrication, and enhanced safety, making nuclear more accessible beyond big utilities. Several SMR designs have achieved regulatory approvals by 2025 and are slated for deployment in the next 5–10 years. Countries like Canada, U.S., UK, and Poland have SMR projects in pipeline. SMRs could power remote communities, industrial sites, or replace coal plants, expanding nuclear’s footprint. Importantly for the uranium industry, many advanced reactors (especially Gen IV designs) require High-Assay Low-Enriched Uranium (HALEU) fuel (up to 20% U-235), which could increase uranium demand per reactor (due to lower burn-up efficiency initially) and create new value-added demand for enrichment services. SMRs also have shorter refueling cycles in some cases, meaning fuel throughput might increase. While still early, the potential mass deployment of SMRs in the 2030s is a bullish demand driver: it’s cited as one reason WNA raised its demand growth forecast from 4.1% to 5.3% CAGR through 2040. Additionally, advanced reactor programs (like TerraPower’s Natrium, X-energy’s Xe-100) have spurred western governments (U.S., Canada) to invest in HALEU production (benefiting companies like Centrus). The SMR trend thus drives both higher uranium volume needs in the long run and shifts in the fuel cycle (more enrichment and specialized fuel fabrication).
New Uses of Nuclear Power (Beyond Traditional Grid Electricity): An emerging trend is nuclear power being considered for non-electric applications, which indirectly boosts uranium demand. For example, the explosion of energy-intensive computing (AI and big data) has tech giants exploring nuclear to power data centers. Microsoft, Google, Amazon, and Meta have all announced initiatives to incorporate nuclear energy for their growing electricity loads. This digital economy linkage could add meaningful reactor demand beyond public utilities. Likewise, nuclear is being eyed for green hydrogen production via electrolysis (providing constant clean power to make hydrogen), for process heat in industrial applications, for desalination, and for district heating in colder climates. Each of these uses could add to reactor build totals or capacity factors. For instance, high-temperature reactors dedicated to hydrogen production or industrial heat could become a niche but significant segment by 2030s. While these are in early stages, they form part of the narrative that nuclear is broadening its value proposition, creating additional sources of uranium demand beyond just grid electricity.
Supply Constraints and Underinvestment: On the supply side, a critical trend is the lasting impact of a decade of underinvestment in uranium mining. From 2013–2017, uranium prices languished around $20–$30/lb, causing many mines to close and exploration spending to collapse. The World Nuclear Association notes that as of 2022, 78% of reactor requirements came from primary production (up from ~60% a few years prior), meaning secondary supplies (stockpiles) have been drawn down heavily. Many mines were depleted or suspended, and very few new projects were developed in the 2010s. Now, even as demand rises, the pipeline of new mines is thin. WNA’s latest Fuel Report warns that existing mine output will fall off sharply by mid-2030s – roughly half of current production capacity may end by 2040 as major deposits are exhausted. Indeed, by 2030, some large sources like Cigar Lake may wind down unless expanded. This sets the stage for a potential structural supply gap. The industry will need to double primary production by 2040 in the upper-demand scenario, requiring many new mines. However, new projects face long lead times (often 7–10 years from discovery to production), so the response is inherently slow. This dynamic (rising demand vs. slow supply response) is a key driver of the current uranium bull market. It has already led to prices climbing from ~$20 in 2017 to ~$70 in 2025. As one industry CEO summarized: “Supply and demand fundamentals suggest the uranium price has to increase substantially… it’s very hard to bring on new supply in time”. The trend of persistently tight supply is further exacerbated by events like COVID-19 disruptions (which briefly removed ~20% of global supply in 2020) and currently by supply chain issues (e.g. acid shortages in Kazakhstan). Combined, these factors serve as a long-term driver for higher prices and incentivize new entrants – but until those mines materialize, existing producers benefit from a seller’s market. In short, the legacy of underinvestment has created a classic commodity upswing backdrop: demand rising into a supply-constrained market, fueling a multi-year bull trend.
Geopolitical Realignment of Uranium Supply Chains: Geopolitics is increasingly influencing where uranium is sourced and how nuclear fuel is procured. A major trend is the effort by Western countries to reduce dependence on Russian nuclear services (conversion, enrichment) and, to some extent, on Kazakh/Uzbek uranium which is exported via Russia. Russia’s war in Ukraine in 2022 spurred calls for embargoing Russian uranium (the U.S. is considering bans on Russian enrichment, the EU and others have discussed reducing imports). Meanwhile, Kazatomprom (Kazakhstan) still supplies 40% of world uranium, but ~50% of Kazakh output currently goes to China, and Kazakh exports to the West rely on transit routes that avoid Russia (a logistic challenge). This East-West bifurcation is prompting western utilities to diversify supply contracts towards non-Russian sources. It’s also driving government support for domestic production in friendly jurisdictions: e.g. the U.S. government’s uranium reserve purchase (buying from U.S. mines), Canada’s inclusion of nuclear in clean investment plans, and potential collaborative stockpiling among allies. One concrete result: Western investment in enrichment capacity – e.g. Urenco in the UK/U.S. expanding, and the DOE funding Centrus – because currently Russia’s Rosatom controls nearly half of global enrichment and much of the conversion capacity. Geopolitics is thus a driver for new upstream investments: friendly-nation uranium projects (in Canada, Australia, Namibia, etc.) are more likely to get fast-tracked and financed due to this security premium. It’s also leading to trade and tariff considerations (the U.S. has discussed re-imposing the Russian suspension agreement limits more stringently). In sum, security of supply is now a key theme, where not all uranium is seen as equal – origin matters. This trend benefits non-Russian producers and is a growth catalyst for projects in stable jurisdictions as utilities re-balance their portfolios. The WNA notes that geopolitical shifts since 2022 are “shaping both global demand for nuclear energy and availability of fuel cycle services” and call for “timely investment” in all fuel supply stages to ensure security.
Financialization of Uranium Markets: In recent years, uranium has seen an influx of financial players and vehicles that are changing market dynamics. The launch of physical uranium investment funds like the Sprott Physical Uranium Trust (SPUT) and Yellow Cake plc is a notable trend. These entities buy and hold physical U₃O₈, taking supply off the market to offer investors direct exposure to uranium price upside. SPUT alone purchased millions of pounds in 2021–2022, contributing to price increases. Such financial demand effectively functions as a new category of demand (neither reactor nor government, but investor-driven). ETFs and specialty funds have also grown – e.g. URNM and URNJ (uranium mining ETFs) have channeled capital into the equities. This increased liquidity and speculative interest can amplify price moves. For instance, spot price volatility in 2021–2022 (when uranium jumped from ~$30 to ~$50+) was partly attributed to these funds aggressively sequestering uranium. The trend continues, with more institutions warming up to uranium as a long-term clean energy play. Additionally, trading volumes and market efficiency have improved – spot market now accounts for ~25% of transactions (up from <15% years ago) and serves as a reference for many term contracts. More active trading and transparency in price discovery (via brokers, price reporting) have made the uranium market more accessible. Overall, financialization has provided miners alternative funding avenues (e.g. selling to Yellow Cake or SPUT for immediate cash) and contributed to a more robust pricing environment. However, it also means higher volatility, as seen in 2022–2023 when prices ran up quickly to ~$60+ and had periodic pullbacks. On balance, this trend supports higher long-term prices by locking away inventories (SPUT+Yellow Cake hold >70 million lbs combined), thereby tightening supply-demand balance.
Innovation in Mining & Milling – Environmental Focus: Technological and environmental trends within the industry are shaping how uranium will be produced:
The continued shift toward In-Situ Recovery (ISR) mining is notable. ISR now accounts for about 50% of world uranium production (mostly in Kazakhstan, Uzbekistan, and USA). ISR mines have a smaller surface footprint and can be developed in modular fashion. They often have lower operating costs and shorter lead times than conventional mines. As environmental regulations tighten, ISR (which avoids open pits or large tailings piles) is increasingly favored when geology permits. For example, companies like Denison are innovating by applying ISR to high-grade sandstone deposits (traditionally mined via underground methods). If successful, this could unlock lower-impact mining of deposits that would otherwise face local opposition due to water use or waste.
There’s also focus on milling innovation and waste handling – e.g. using existing mills (like White Mesa, Shootaring) to process ore from various small mines, reducing the need for new milling infrastructure. Heap leaching for low-grade resources, more efficient tailings management, and deployment of remote monitoring and automation (as Cameco did during McArthur River’s care-and-maintenance upgrades) are improving safety and lowering costs.
On the ESG front, uranium mining is striving to clean up its image. This includes better engagement with Indigenous communities (e.g. Energy Fuels negotiating with Navajo Nation for ore transportans.org, Canadian firms partnering with First Nations on project equity), improved remediation plans, and highlighting nuclear’s role in climate change mitigation to counter anti-uranium sentiment. The industry is marketing that “new methods are much cleaner than past practices” – notably the dominance of ISR (which leaves 70% of radioactivity in-ground and uses far less surface disturbance) as evidence.
Another angle is secondary supply innovation: efforts to re-enrich tails (depleted UF₆) or recycle uranium from spent fuel could marginally contribute. Russia has done tails re-enrichment for years; now Orano and others are looking at it again given high prices. It won’t replace primary mining but can add flexibility.
🎯 Key Success Factors and Profitability Drivers
The profitability of uranium upstream companies is driven by a combination of market factors and project-specific attributes. Key drivers include:
Uranium Price Realizations: The single biggest lever for profitability is the market price of uranium (U₃O₈) relative to production costs. Uranium price swings directly affect miner margins – when prices are high, even relatively high-cost mines become profitable; when prices fall below cost, mines quickly flip to losses. After Fukushima (2011), prices dropped >70% to ~$20/lb, forcing widespread losses and mine closures. Now with prices in the $60–$70/lb range, many operations have moved into the black. For example, Cameco’s average realized price jumped from $43/lb in 2017 to ~$79.70/lb in 2024, boosting its gross profit accordingly. Profitability is highly sensitive to price because uranium mining has a high fixed-cost component – once a mine is running, cash costs per pound may be $20–30, so each additional dollar on the sales price largely flows to the bottom line. Many new projects, however, require prices in the $50–$70+ per lb range to be viable (to cover full costs including capital). Industry experts estimate incentive prices above ~$95–$100/lb are needed to bring significant new greenfield production online. Thus, current producers with existing assets enjoy a cost advantage and strong margins at today’s ~$70/lb (since most operating mines have AISC well below $70).
Ore Grade and Deposit Type (Cost of Production): The cost structure of a uranium mine is primarily determined by the ore grade, mineralogy, and mining method. High-grade deposits (like those in Athabasca with 1%–20% U₃O₈) allow far more uranium to be extracted per ton of rock, drastically lowering per-pound costs – these mines tend to be extremely profitable when operating. For instance, Cameco’s McArthur River and Cigar Lake, with grades 50–100x the world average, have operating costs reportedly in the lowest quartile (historically <$20/lb). In contrast, low-grade mines (e.g. 0.01%–0.05% U) must move huge tonnages, raising costs. This is why Kazakh ISR mines (low grade ~0.05% but ISR method is cheap) and Athabasca mines (very high grade ~5–20%) are among the most profitable sources. The mining method is also critical: In-Situ Recovery (ISR) tends to have lower operating and capital costs than conventional mining. ISR avoids drilling, blasting, and milling of large rock volumes – instead, solution is circulated underground to dissolve uranium. According to WNA/TradeTech data, ISR mines often have lower C1 cash costs, and while they have ongoing wellfield capital, they can achieve low fully-loaded costs if resources are amenable. For example, Kazatomprom’s ISR operations in Kazakhstan produce profitably at ~$20–$30/lb all-in cost, which was still above spot in the 2010s but now yields solid margins. Conversely, conventional underground or open-pit mines with difficult metallurgy or deep ore (e.g. some projects in Africa or low-grade U.S. conventional mines) might have breakeven costs in the $60–$80 range, making them marginal unless prices are high. To break it down:
Grade: higher grade = fewer tonnes to mine per lb of U = lower cost per lb.
Depth and geology: shallow deposits or those in permeable sandstone (ISR-suitable) are cheaper; deep hard-rock deposits need shafts, etc., raising capital and operating costs.
Mining method: ISR (or heap leach) vs. underground vs. open-pit – each has different cost profiles. Open pits remove a lot of waste (high stripping) but are simpler operations; underground has less surface disturbance but higher labor and technical demands. ISR has high upfront wellfield capital but then relatively steady low operating cost (mostly acid, pumps, etc.). Trade-offs are seen in the cost structure: for ISR, only ~25–30% of lifecycle cost is operating cash cost, ~50% is upfront and sustaining capital, whereas for open-pit mines ~70% of cost is operating cost and ~20% capital. This means ISR profitability can be sensitive to ongoing wellfield investment but generally benefits from low variable cost, whereas conventional mine profitability is more sensitive to day-to-day operating efficiency.
Scale and Capacity Utilization: Mining is subject to economies of scale. Larger operations that can achieve high throughput and spread fixed costs over more pounds tend to have better unit economics. For example, a mill processing 3,000 tonnes/day vs. 300 t/day will have much lower cost per ton processed. Cameco’s McArthur/Key Lake operation benefited from scale (producing 18 Mlbs/year at its peak), which lowered its unit costs significantly. Conversely, small-scale mines (like boutique U.S. conventional mines producing <0.5 Mlbs/year) often struggle with high unit costs because fixed expenses (regulatory, overhead, milling) are supported by few pounds. Running assets at high utilization also improves profitability – e.g. when Cameco idled McArthur River 2018–2022, costs accrued without revenue, hitting margins; now at full run-rate, profitability returned. Similarly, Ur-Energy’s Lost Creek operating at only a trickle for years had negative gross margins, but as it ramps up production toward capacity, unit costs drop and margins improve. Capacity utilization is a key near-term profitability lever: e.g. Energy Fuels in 2024 used White Mesa Mill for both uranium and rare earths, increasing utilization which helped cover fixed costs, thereby improving margins on both products. In sum, bigger and fuller operations = lower cost per lb = higher profits.
Contract Portfolio and Pricing Strategy: How a company sells its uranium significantly impacts realized price and thus profitability. Companies with favorable long-term contracts (i.e. at prices above spot during downturns) maintained profitability better in the 2010s. For example, Cameco had legacy contracts in the ~$50s per lb during the 2016–2019 period when spot was $25–$30, allowing it to stay cash-flow positive. By 2024, Cameco’s newer contracts included market-related pricing which benefited from the price upswing. The mix of fixed vs. market-based contracts, contract durations, and customer portfolio all matter:
Downside protection vs. upside exposure: A company heavily hedged at low fixed prices could miss out on a bull market (hurting short-term profitability). Conversely, too much spot exposure in a weak market hurts margins. Striking the right balance is key. Cameco, for instance, now seeks market-linked contracts with floors – this way they ensure a minimum profitable price, but also get upside if market rises. That approach smooths profitability over cycles.
Creditworthiness of buyers and contract performance: Utilities are generally reliable buyers, so contract default risk is low. But one must consider delivery obligations – if a miner has contracted more than it can produce (especially juniors signing contracts), it might have to buy in the market to deliver if production falters, potentially at a loss. Keeping contracts aligned with production capability avoids that.
Conversion & enrichment components: Sometimes miners sell UF₆ (enriched product) or partner to include conversion in the sale. For instance, companies that can offer an integrated fuel bundle might command better pricing. But pure upstream usually sells U₃O₈. Centrus, on the other hand, profits from SWU (separative work unit) prices in enrichment contracts. Its profitability depends on the spread between SWU price and its cost. Currently, enrichment prices have surged (Western SWU > $150/SWU in 2023 from ~$60 a few years ago) due to Russian supply concerns, benefiting enrichers. This is analogous to uranium price for miners – a key driver for Centrus is SWU market rate. In 2022–2023, Centrus enjoyed a lucrative DOE contract that paid for HALEU production, directly boosting its marginsans.org. So for fuel service providers, their “commodity price” is the service fee (SWU, conversion price). High utilization of their enrichment capacity also lowers unit cost (Centrus running its AC100s at capacity yields lower per-SWU cost).
Operating Efficiency and Cost Management: Within any given mine’s control, efficient operations drive profitability. This includes:
Cost control on inputs: Uranium mining uses reagents (acid, peroxide), electricity, diesel, and labor. Managing these costs (through bulk procurement, local sourcing, or process optimization) can improve margins. For instance, Kazakhstan’s ISR mines faced a constraint with sulfuric acid supply in 2022–2023; acid shortages limited production. When acid prices spiked, it pressured costs. Companies that invest in securing supplies (Kazatomprom built its own acid plant) or improving acid utilization have an edge.
Labor and productivity: Skilled labor is needed for safe operations. In some regions (e.g. remote Canadian north or Australian outback), labor is costly and fly-in-fly-out. Automation (use of tele-remote mining at Cigar Lake for example) can improve productivity and reduce labor cost per lb. Safety and environmental compliance are also crucial – poor safety can lead to shutdowns or fines, which hurt profitability. The best operators avoid costly incidents by maintaining high standards.
Recovery rates and grades vs. plan: In mining, actual recovered grade vs. expected grade affects output. If a mill recovers 90% of uranium in ore vs. a planned 95%, that’s a 5% revenue hit. Continuous improvements (better ore blending, improved leaching chemistry) can raise recoveries. Denison’s field tests indicated ~97% recovery of uranium in ISR leach trials – if that can be replicated at scale, it maximizes revenue per amount of resource, boosting project NPV and margins. Essentially, technical optimization (recovery, throughput, equipment reliability) directly drives cost per lb.
Royalties and taxes: The take by governments varies widely. Profitability for miners in high-royalty regimes (e.g. some jurisdictions have 5–10% gross royalties plus corporate tax) is lower than in places with minimal royalties. For example, Uranium Energy Corp operates in U.S. states with royalty burdens (Texas has ~8.25% severance tax equivalent; Wyoming around 4% severance + federal royalty on federal leases). Cameco in Canada pays provincial royalties that escalate with price. These extrinsic costs affect net margins per lb.
Economies of scope: Companies like Cameco and Orano that have conversion facilities or fuel fabrication can sometimes capture more value (conversion prices have soared recently to ~$30/kgU from <$10 a few years ago, benefiting those with conversion capacity). Cameco’s fuel services division significantly added to earnings in 2024 (division revenue C$459M) and enjoyed an 88% jump in Q1 2025 due to higher conversion prices. This vertical integration provided an additional profitability lever beyond mining.
Project Stage and Capital Efficiency: It’s worth noting that developers vs. producers face different “profitability” considerations. Developers (NexGen, Denison) currently have negative earnings and cash flow (e.g. Denison’s EBITDA margin was ~-155%) because they are spending on exploration and studies with no revenue. Their “profitability” will come only once mines are built. So for them, a key driver is access to low-cost capital – if they can finance development cheaply (through strategic investors, farm-outs, etc.), they preserve future project IRR. Companies that manage to fund construction without excessive dilution or high debt costs will deliver higher eventual per-share earnings (a win for shareholders).
Also, timing of project execution matters – building a mine on budget and on schedule ensures that capital costs don’t spiral and that the mine can catch favorable market conditions. For instance, Paladin’s Langer Heinrich restart was timed to complete in 2024 when prices are high, which will likely yield strong early cash flows to payback investment.
Primary Fuel Cycle Cost Drivers: In enrichment (for Centrus), profitability drivers include:
SWU price (as noted),
Centrifuge efficiency and output: how many SWU per machine and energy cost per SWU. If Centrus can improve its centrifuge output or get cheap power, it improves margins.
Government support: Centrus’ HALEU contract is cost-plus; DOE covers a portion of costs, effectively guaranteeing a profit. Extension of such contracts or additional government incentives for domestic enrichment (which are likely given geopolitical aims) directly boost Centrus’ bottom line.
Utilization of enrichment capacity: If Centrus can fill its cascade with commercial work after the DOE demo, each additional SWU sold spreads fixed costs (facility overhead) and increases profit per unit.
Exchange Rates: Many uranium producers incur costs in local currency but sell uranium in USD (the global pricing currency). For example, Cameco’s mines are in Canada (costs in CAD) but sales in USD; Kazatomprom costs are in Kazakhstani Tenge, sales in USD. A weak local currency vs. USD reduces costs in USD terms, boosting profit. In recent years, a strong US dollar has benefited Canadian producers – Cameco noted that a weakening CAD (vs. USD) added to its realized price advantage in 2025. Conversely, currency appreciation can hurt. Thus, macro forex trends can be a subtle profitability driver for multi-national producers.
In practical terms, this is why Cameco and Kazatomprom are very profitable at $60–$70/lb, why many U.S. juniors needed ~$70+ to restart (and are only now turning cash-flow positive), and why developers push for financing when prices approach incentive levels. It also explains company behavior: e.g. Cameco’s willingness to cut production in 2018 was a bet on price as the main profit driver (foregoing volume at unprofitable prices to support a future with higher prices). Now that prices have improved, profit drivers are aligned and those cuts have paid off in the form of a tighter market and higher margins for all producers.
💼 Porter’s Five Forces Analysis
1. Threat of New Entrants – Moderate to Low.
Barriers to entering uranium mining are fairly high due to the specialized nature of the industry:
Resource Availability & Exploration Barrier: Viable uranium deposits are geologically scarce and often already controlled by existing companies or state entities. Discovering a new significant deposit requires substantial exploration investment and luck. Most new entrants cannot easily “find” a world-class deposit – the low-hanging fruit has largely been found (e.g. Athabasca giants, Kazakh ISR fields, etc.). Additionally, acquiring known deposits through M&A is capital-intensive.
Capital Intensity: Developing a uranium mine (especially conventional underground or open-pit) is extremely capital-intensive – often hundreds of millions to over a billion USD for large projects (e.g. NexGen’s Arrow FS is ~$1.3B capex). ISR mines are cheaper but still require tens of millions and technical know-how. New entrants without deep financial backing face a steep hurdle. Financing can be challenging given uranium’s historical price volatility and the long lead times (investors must wait years for returns). Only during strong uranium bull markets do capital markets open up enough to fund many newcomers (e.g. mid-2000s saw a wave of juniors, many of which later vanished when prices fell).
Regulatory and Technical Barriers: Uranium mining is heavily regulated due to radiation and environmental concerns. Permitting a new mine can take years – e.g. in the U.S., obtaining all necessary permits has stretched close to a decade for some projects due to public opposition and rigorous environmental reviews. For instance, Canada’s regulatory process and community consultations add time and complexity (though Canada is mining-friendly, it’s still rigorous). In the U.S., uranium projects face opposition for environmental reasons (e.g. Virginia’s uranium mining ban, ongoing challenges in Arizona near the Grand Canyon). These factors discourage casual new entrants. Nuclear regulatory experience and a strong safety culture are needed to operate – not easily acquired by newcomers.
Economies of Scale and Experience: Incumbents like Cameco, Orano, and Kazatomprom have decades of experience, established teams, and existing infrastructure (mills, conversion facilities, logistics) which give them cost and speed advantages. New entrants starting from scratch must often partner with experienced firms (or hire their expertise) to overcome the steep learning curve of handling radioactive material and complex hydrometallurgy.
Market Barriers (Customers and Contracts): Utilities typically prefer to buy from proven producers with reliable track records. A new entrant without a production history might struggle to secure long-term contracts initially, forcing them to sell into the spot market – a risky proposition that can deter project financing. Establishing relationships with utility buyers and qualifying as an approved supplier (utilities do due diligence on producers’ sustainability and capabilities) raises the bar for entry.
That said, when uranium prices are high, the allure of high margins can attract new entrants (as seen in past cycles, a swarm of junior exploration companies emerge in bull markets – over 400 new uranium juniors formed in the 2003–2007 boom. However, very few of these entrants ever become actual producers; most either fail, consolidate, or sell projects to larger players. The industry today is relatively consolidated at the top (a few big producers control majority output), and although we are seeing new projects (led by juniors) being developed, they often require partnerships or buyouts to come to fruition. Overall, the threat of brand-new entrants is tempered by high entry barriers – one can’t easily start a uranium mine like a tech startup. Thus, this force is moderate-to-low. The most credible “new entrants” are usually sponsored by governments (e.g. in India or China, state companies starting domestic mining – but those are not exactly new commercial competitors on the open market) or are spin-offs led by industry veterans with strong financing. The established players’ moat comes from resource ownership, technical expertise, and regulatory approvals, making it challenging for a newcomer to disrupt quickly.
2. Bargaining Power of Suppliers – Low to Moderate.
Suppliers to uranium mines include equipment manufacturers (drilling rigs, mining machinery), chemical suppliers (sulfuric acid, hydrogen peroxide, lime, etc.), energy providers (electricity or diesel fuel), and specialized service providers (geophysical logging, drilling contractors). In general:
Commodity Inputs: Many inputs are commodities available from multiple sources. Sulfuric acid, for instance, is widely produced (often as a by-product of other industries). Uranium operations can typically source acid from regional chemical plants; if one supplier raises prices too much, miners can seek alternate suppliers or even build dedicated acid plants if scale permits (Kazatomprom did so to reduce reliance on third-party acid). Fuel and power are usually obtained from local utilities or fuel distributors; while prices can fluctuate (diesel spikes can raise mining costs), uranium mines are not uniquely dependent on any single fuel supplier – they pay market rates like other mines.
Specialized Mining Equipment: Some equipment (like raiseboring machines for shaft mines or specialized resin beads for ISR ion exchange) has a limited supplier base. However, the mining industry at large has several major equipment OEMs (Caterpillar, Sandvik, Komatsu, etc.) that compete, and uranium miners typically use standard mining equipment. The bargaining power of these suppliers is not extraordinary because they cater to the broader mining sector, not just uranium, and miners can choose among competing brands or even buy used equipment in downturns.
Services and Contractors: Drilling contractors or geological service firms might have some local power if highly specialized. But again, there are many drilling contractors globally; during booms demand is high and rates rise, but miners can schedule work or bring in international crews if local rates are too high.
Labor as Supplier: Skilled labor (engineers, radiation safety experts, geologists) can be considered a “supplier” in terms of talent. In some remote areas or during industry expansions, there is a labor shortage which can increase labor costs (e.g. competition for experienced geologists in Athabasca or ISR technicians in Wyoming). However, labor generally does not exercise unified bargaining power; it’s more of a cost driver than a negotiating bloc, except where strong unions exist (certain Canadian operations are unionized, but labor disputes in uranium mining have been infrequent historically).
Unique Inputs: One area where suppliers had some power was conversion and enrichment services, but those are downstream (utilities face that, not miners). For mining itself, the suppliers do not typically integrate forward or hold sway over mine operators. For instance, if sulfuric acid supply is tight (as happened in Kazakhstan), it can temporarily constrain productioncameco.com, but miners mitigate this by stockpiling or developing acid plants, reducing long-term dependency.
3. Bargaining Power of Buyers – Moderate.
The buyers in the uranium upstream industry are primarily electric utility companies (nuclear power plant operators) and to a lesser extent intermediaries/traders. Key considerations:
Buyer Concentration: On one hand, there are a limited number of nuclear utilities globally (around 50+ nuclear utility companies or consortia for ~440 reactors). They tend to be large, sophisticated organizations (often state-owned or heavily regulated entities) that purchase in bulk. This gives them some bargaining leverage, especially when supply is ample. For example, post-Fukushima, utilities had plentiful supplier options and could play producers off against each other, resulting in very utility-favorable contracts (low prices, flexible terms). Utilities also formed buying consortia or used fuel procurement consultants, further strengthening their position. A historical example: in the late 1980s and 1990s, utilities’ stockpiles and secondary supplies (like downblended Soviet warheads) glutted the market, enabling utilities to secure uranium at low prices for long periods.
Switching Costs: For a utility, switching uranium suppliers is not very costly in technical terms – U₃O₈ is a fungible commodity once it meets specs. Utilities typically seek diversity of supply for security reasons, but they can choose among many producers worldwide. If one producer offers a better price or contract flexibility, a utility can shift future contracts to them relatively easily (subject to origin considerations if any – some utilities avoid certain origins due to policy, but generally uranium is uranium). This ease of switching gives buyers leverage on price negotiations in a loose market.
Buyer Alternatives/Substitutes: Utilities must have uranium to run their reactors – there’s no substitute fuel for an operating reactor (aside from MOX which is a minor portion, and re-enriched tails or secondary sources, which are finite). However, utilities can draw on secondary supplies as an alternative to buying newly mined uranium. They have inventories (most keep 1–3 years of fuel in reserve), and there are secondary markets for uranium (government stockpile sales, enrichment underfeeding, etc.). In times of oversupply, utilities can rely more on these alternatives and delay contracting – as seen in the 2010s when many utilities sat on the sidelines while prices were low, buying on spot as needed, which put pressure on miners. This dynamic gave utilities bargaining power – the ability to defer procurement or use inventories as leverage to wait out high prices.
Contract Structure Influence: Utilities often dictate contract preferences (they favor long-term deals with fixed or capped prices to maintain cost certainty). In the 2020s upswing, producers are pushing for more market-related pricing. The power dynamic here is shifting slightly toward producers due to tight supply, but historically utilities had the upper hand in contract negotiations (e.g. during oversupply, they could insist on ceilings or one-way market flex in contracts that benefited them).
Recent Changes – Buyer anxiety: Now, with supply looking tighter and geopolitical concerns, utilities are increasingly concerned about security of supply. This has weakened their bargaining stance somewhat; many utilities have returned to long-term contracting to lock in future fuel. In 2022–2023 a huge volume of contracting occurred (over 114 Mlbs term contracting in 2022, and even more in 2023) as utilities scrambled to cover unfilled requirements. When buyers fear scarcity, the power shifts toward sellers. We are seeing this shift: the long-term price has risen to ~$50–$55/lb in 2023–24, and utilities are accepting market-linked terms they avoided before because they need to ensure supply.
Buyer vs. Seller balance: Historically, uranium producers (especially state-backed ones like Kazatomprom or vertically integrated ones like Orano) have limited marketing arms and often rely on a small set of major buyers, which gave those buyers leverage. But with the entry of intermediaries (traders, funds like Yellow Cake and SPUT buying and holding uranium), some demand has been price-insensitive (financial buyers), which actually reduces utilities’ relative bargaining power because they now compete with financials for some supply.
On balance, buyer power has been moderate. In glutted markets, utilities exert strong power (driving prices down, extracting favorable terms). In tight markets, their power diminishes (they become price-takers to secure volume). Currently, the trend is toward a tighter market – utilities are worried about future supply (especially non-Russian supply), which has reduced their bargaining leverage. But they are still sophisticated and can draw on inventories or adjust burn cycles slightly, giving them some options. Utilities also have political clout (they lobby for government support like strategic uranium reserves, which indirectly benefits producers but also ensures utilities aren’t left without fuel). No single utility is big enough to dictate global prices (even the largest consume only a few percent of global demand annually), but collectively their procurement practices influence market terms. Also, since nuclear fuel cost is a small portion of a reactor’s operating cost (~10–20%), utilities are more concerned with supply certainty than haggling the last dollar off the price – which in recent times means they’re willing to pay up to ensure they get uranium from reliable sources.
4. Threat of Substitutes – Low (for uranium as reactor fuel); Moderate (for nuclear power in energy mix).
The threat of substitutes can be viewed on two levels:
Fuel substitute for uranium in reactors: For existing nuclear reactors, there is essentially no substitute for uranium fuel. A reactor designed for uranium dioxide fuel cannot use another element as fuel (thorium reactors exist in experimental form, but there are no commercial thorium-fueled reactors yet; MOX fuel uses plutonium mixed with uranium, but plutonium itself is derived from spent uranium fuel). Uranium-235’s unique properties (fissionable with thermal neutrons) make it the only practical fuel for the current global reactor fleet (plus some usage of plutonium via MOX). The only possible “substitute” in a reactor is using MOX fuel (mixed oxide, which substitutes some U-235 with Pu-239 from reprocessed fuel). However, MOX usage is limited (only a handful of reactors in France, Japan use MOX, and it displaces at most ~10% of uranium demand globally). Even MOX relies on reprocessed uranium and plutonium from uranium fuel – not a fundamentally different source. Hence, within the nuclear fuel cycle, there’s effectively no alternative to uranium for the vast majority of reactors. Nuclear utilities must have uranium; they can’t burn coal or gas in a reactor. This means for uranium producers, if a reactor is running, the utility has to buy uranium from someone – which is good (captive demand). This gives producers some inherent power in that there’s no risk a utility will “switch” its reactor to another fuel source on a whim (it’s technologically impossible).
Energy substitute for nuclear power: A broader perspective is whether other energy sources could substitute for nuclear generation, thereby reducing uranium demand. This is a real dynamic in the energy sector: natural gas, coal, or renewables (wind, solar) can generate electricity that might otherwise be generated by a nuclear plant. If utilities or governments decide to phase out nuclear in favor of these alternatives (as Germany did post-Fukushima, replacing nuclear with renewables and some coal/gas), that cuts uranium demand dramatically. For example, the planned German reactor shutdowns in 2011–2022 eliminated the need for millions of pounds of uranium per year. Similarly, cheap shale gas in the U.S. made it harder for some nuclear plants to compete economically, leading to premature closures – another form of substitution (gas substituting nuclear in the grid). So the threat here is not to an individual reactor once built, but to nuclear power’s share in the electricity mix. Renewables + storage, for instance, are often cited as a cleaner substitute for both coal and nuclear. If policy or economics favor wind/solar over new nuclear, the “demand pie” for uranium could be smaller than projected. Historically, in the 1980s–2000s, cheaper fossil energy and lower-than-expected electricity growth curtailed nuclear expansion. However, with decarbonization goals, nuclear is now seen as complementary to renewables rather than a competitor – many net-zero models include a strong role for nuclear, addressing climate concerns that fossil fuels cannot solve.
Another angle: technological substitution like fusion – nuclear fusion power (if commercialized, which is still likely decades away) could eventually substitute fission reactors and thus eliminate uranium demand. But fusion remains speculative and outside the 20-30 year planning horizon for now.
Given the time frame and practical realities, the threat of direct substitutes for uranium fuel is essentially zero in the next couple decades – reactors need uranium. The relevant substitution threat is alternative generation sources impacting nuclear’s growth. With current global priorities (energy security and carbon neutrality), many countries are now favoring keeping nuclear or expanding it (substitutes like gas have lost favor due to price volatility & emissions, and renewables, while growing fast, have intermittency issues that nuclear can help solve). That said, nuclear’s high capital cost could still lead some countries to opt for gas or coal (in developing countries with cost pressures) or renewables + storage instead of nuclear – a choice that would substitute away potential uranium demand. Overall, though, as long as the world maintains or increases nuclear capacity (as trends indicate), the substitute threat remains controlled. Uranium’s unique role in fueling reactors gives it a strong moat in its niche – no other fuel can replace it in an operating reactor, and alternative electricity sources are more about overall energy policy than a direct one-for-one substitute for uranium.
5. Industry Rivalry – Moderate.
The uranium upstream industry is somewhat unusual: it’s not a high-volume consumer commodity market with lots of sellers and price wars (like say iron ore), but it also isn’t a tightly controlled cartel with stable prices (like OPEC’s ideal). Key points on rivalry:
Concentration of Key Producers: A few large players account for a big share of production – e.g. Kazatomprom (Kazakhstan) ~40% of world supply, Cameco ~15–20% (with its share of Canadian and some Kazakh output), Orano ~10%, Rosatom/U1 ~5–10%, plus a handful of mid-tiers (e.g. BHP’s Olympic Dam by-product, CNNC in Namibia, etc.). This means the top 5 producers can influence market outcomes by their decisions. Rivalry is tempered by the fact that many are state-involved and have shown discipline in output. For example, Kazatomprom since 2017 has voluntarily kept production ~20% below capacity to avoid flooding the market. Such behavior (supply discipline, akin to a quasi-cartel action) indicates rivalry is not cutthroat; producers prefer price support over volume grabs. Cameco similarly curtailed production (shutting McArthur 2018–2022) during low price periods, choosing not to engage in a price war for market share. This cooperative dynamic (implicitly coordinating to balance supply) reduces direct rivalry.
Many Juniors, But Few Producers: There are numerous junior companies, but they are more collaborators or future acquisition targets than current rivals in selling uranium. They typically don’t compete in the market until they produce. Even when new mines start (e.g. Husab in Namibia or new ISR startups in the U.S.), their volumes are relatively small or already factored in by utilities. The industry tends to avoid oversupplying because it learned from the post-Fukushima glut that low prices hurt everyone. In fact, producers often act in unison to some extent – e.g. after Fukushima, many cut output; during COVID, multiple producers halted operations (some due to health, but it also tightened supply).
Market Structure and Contracts: Uranium is sold largely via bilateral contracts rather than exchanges, which softens overt rivalry. Producers don’t typically underbid each other openly in a transparent market. They negotiate behind closed doors with utilities, often on differentiated terms (delivery flexibility, origin, etc.). This reduces the intensity of price-based rivalry because there’s not a daily “undercutting” in an open market. In the spot market, traders handle a chunk of volumes – producers feed the spot as needed but often at arms-length (e.g. selling to traders).
Product Homogeneity: Uranium product (U₃O₈) is largely homogeneous (meeting certain specs). In theory, this would heighten rivalry as price is the main differentiator. However, origin and reliability differences provide some differentiation. Some utilities prefer diversified origin (so one producer might not displace all others even if slightly cheaper). Also, not all producers can ramp up at will due to technical and regulatory constraints, limiting price wars on volume.
Excess Capacity: For a long period (2011–2017), there was excess capacity and inventory, contributing to intense rivalry in the sense that producers fought for the limited contracting opportunities (often by lowering prices or offering better terms). Now, capacity is more balanced with demand. If a new glut occurred (say if a demand drop or too many mines come online simultaneously), rivalry could heat up again with producers trying to secure contracts at the expense of others. But given the difficulty of quickly expanding production (few new mines ready), severe rivalry is unlikely in the near term.
Exit Barriers: Uranium mines can be placed on care-and-maintenance relatively easily (as seen by many shutdowns in 2010s). Companies mothball mines rather than operate at a loss, which actually reduces rivalry because they choose to exit production temporarily instead of produce and dump product cheaply. This behavior (exiting until conditions improve) is a mitigating factor that prevents destructive competition.
Geopolitical Factor: Some producers are state-backed and might prioritize strategic goals over pure commercial rivalry. E.g. Rosatom (Russia) might supply allies at favorable terms for influence rather than compete on price in open markets. This again diffuses typical market rivalry patterns.
Overall, rivalry among existing uranium producers is moderate. It’s not a highly fragmented free-for-all, but neither is it a tight official cartel with production quotas (though a cartel-like dynamic has emerged with KAP and Cameco exercising discipline). There is a degree of cooperative behavior implicitly – evidenced by production cuts to support price. Companies have realized that aggressive expansion hurts everyone by crashing prices (as happened after 2007 when many new mines came online and the market overshot). Now the major players exhibit restraint. However, should one major producer break ranks (for instance, if Kazakhstan decided to maximize volume regardless of price or if a country dumps strategic inventory), it could trigger more aggressive competition. As it stands, most producers favor price stability and long-term contracts over volume conquest. The number of true competitors is limited, and their actions are somewhat interdependent (each watches the others when making output decisions).
💵 Financial Metrics Analysis (Profitability & Efficiency)
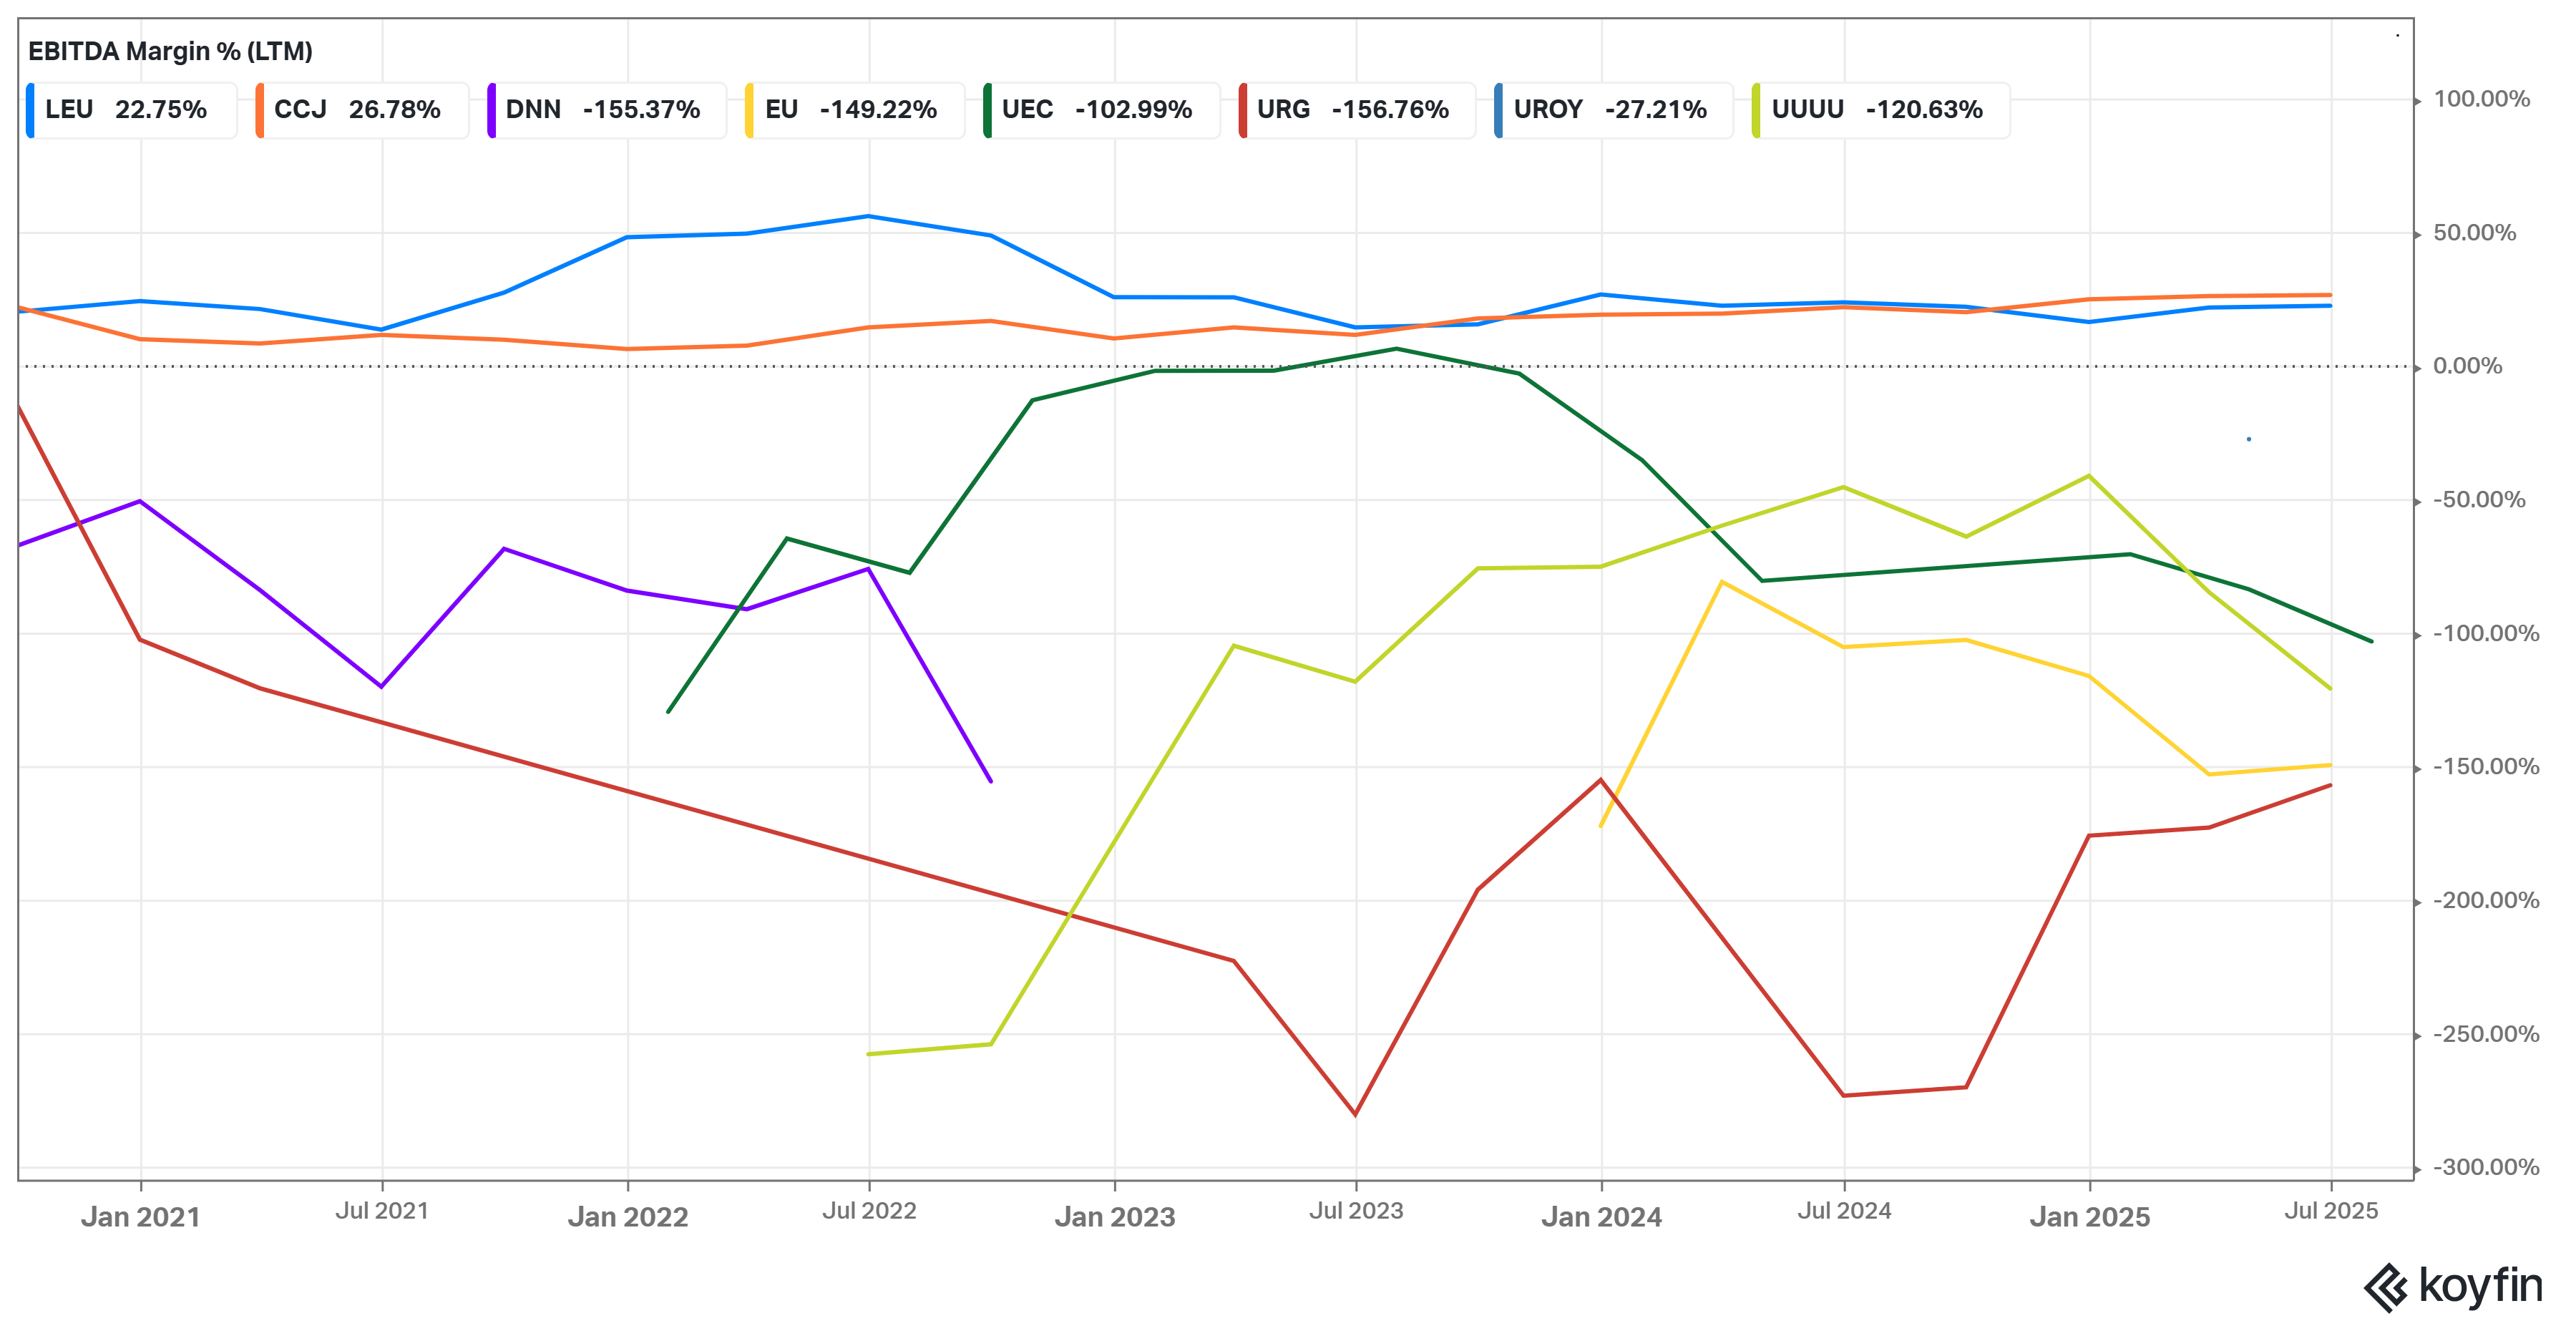
Cameco (CCJ) boasts an EBITDA margin of ~26.8%. This is a healthy margin, it reflects Cameco’s position as a low-cost producer with improved pricing. Over the last few years, Cameco’s EBITDA margin climbed from single digits (when McArthur was idled) to over 25% as high-margin Tier-1 production resumed and prices rose. A 26–27% margin in mining is strong, showing Cameco has significant cost discipline and pricing power. We see in the graph that CCJ’s margin has been consistently positive and rising.
Centrus (LEU) has an EBITDA margin of ~22.8%. Nearly as high as Cameco’s, this indicates Centrus’s enrichment services are quite profitable. Enrichment can have high margins when the facility is utilized and SWU prices are favorable.
All other companies have negative EBITDA margins, often extremely negative:
Denison (DNN): EBITDA margin about -155%, meaning its operating losses are 1.5 times its revenue. This is because Denison’s only revenue might be a few million (from toll milling Cigar Lake ore and environmental services), while its exploration and G&A costs far exceed that, resulting in a large negative EBITDA. The chart shows DNN’s margin has been deeply negative, though it improved to around -100% at one point then worsened again, likely depending on one-time revenue events or spending changes.
enCore (EU): EBITDA margin -149%. Similar story: enCore had minimal revenue in early 2024 (just starting sales from Rosita/Alta Mesa), but full expenses of running multiple projects, so huge negative margin. Essentially, for every $1 of revenue, enCore spent $2.49 in operating costs – a clear sign of ramp-up stage.
Ur‑Energy (URG): EBITDA margin around -156.8%. URG’s cost of production and overhead were far above its 2024 revenue (though it sold some pounds, it’s still scaling up and had many fixed costs while production was low). The margin improved from earlier (it was likely even worse when it had zero revenue and only care costs), but at -157% it indicates heavy losses relative to sales. URG’s Q4 2024 was actually EBITDA-positive (selling to DOE at $64/lb), but trailing full-year still negative due to first half being ramp-up.
Uranium Energy Corp (UEC): EBITDA margin about -103%. UEC had some revenue (from inventory sales or initial production), but its operating expenses (including exploration, holding costs for multiple projects, and SG&A) were roughly double its revenue, yielding a -100% margin. It actually improved during late 2022 when it sold a large inventory chunk (the margin chart shows UEC’s margin briefly got closer to zero then fell again).
Energy Fuels (UUUU): EBITDA margin around -120.6%. Energy Fuels had a relatively high revenue in 2024 (~$78M), but its operating costs including rare earth processing startup, mining restart costs, and corporate overhead led to a sizeable negative EBITDA. A -120% margin means expenses were ~2.2 times revenue. However, note that Energy Fuels’ margin was even worse in prior years (the chart shows it hitting -200% to -300% during times of minimal revenue). The trend by end of period is improving (rising toward -100%). With increasing product sales (uranium, RE carbonate) in 2025 and beyond, we expect this margin to continue improving towards break-even.
Uranium Royalty Corp (UROY): EBITDA margin -27.2%. This is notably less negative than others and indicates URC is relatively close to operating break-even. A -27% margin means URC’s operating loss is only about one-quarter of its revenue – not bad for a growth-stage company. It earned interest and some royalty revenue to offset most of its G&A. URC’s lean cost model (few employees, no mine ops) contributes to this relatively small negative margin. In fact, URC was EBITDA-positive in some quarters where it sold inventory or received one-off payments, which is why its current margin is only modestly negative.
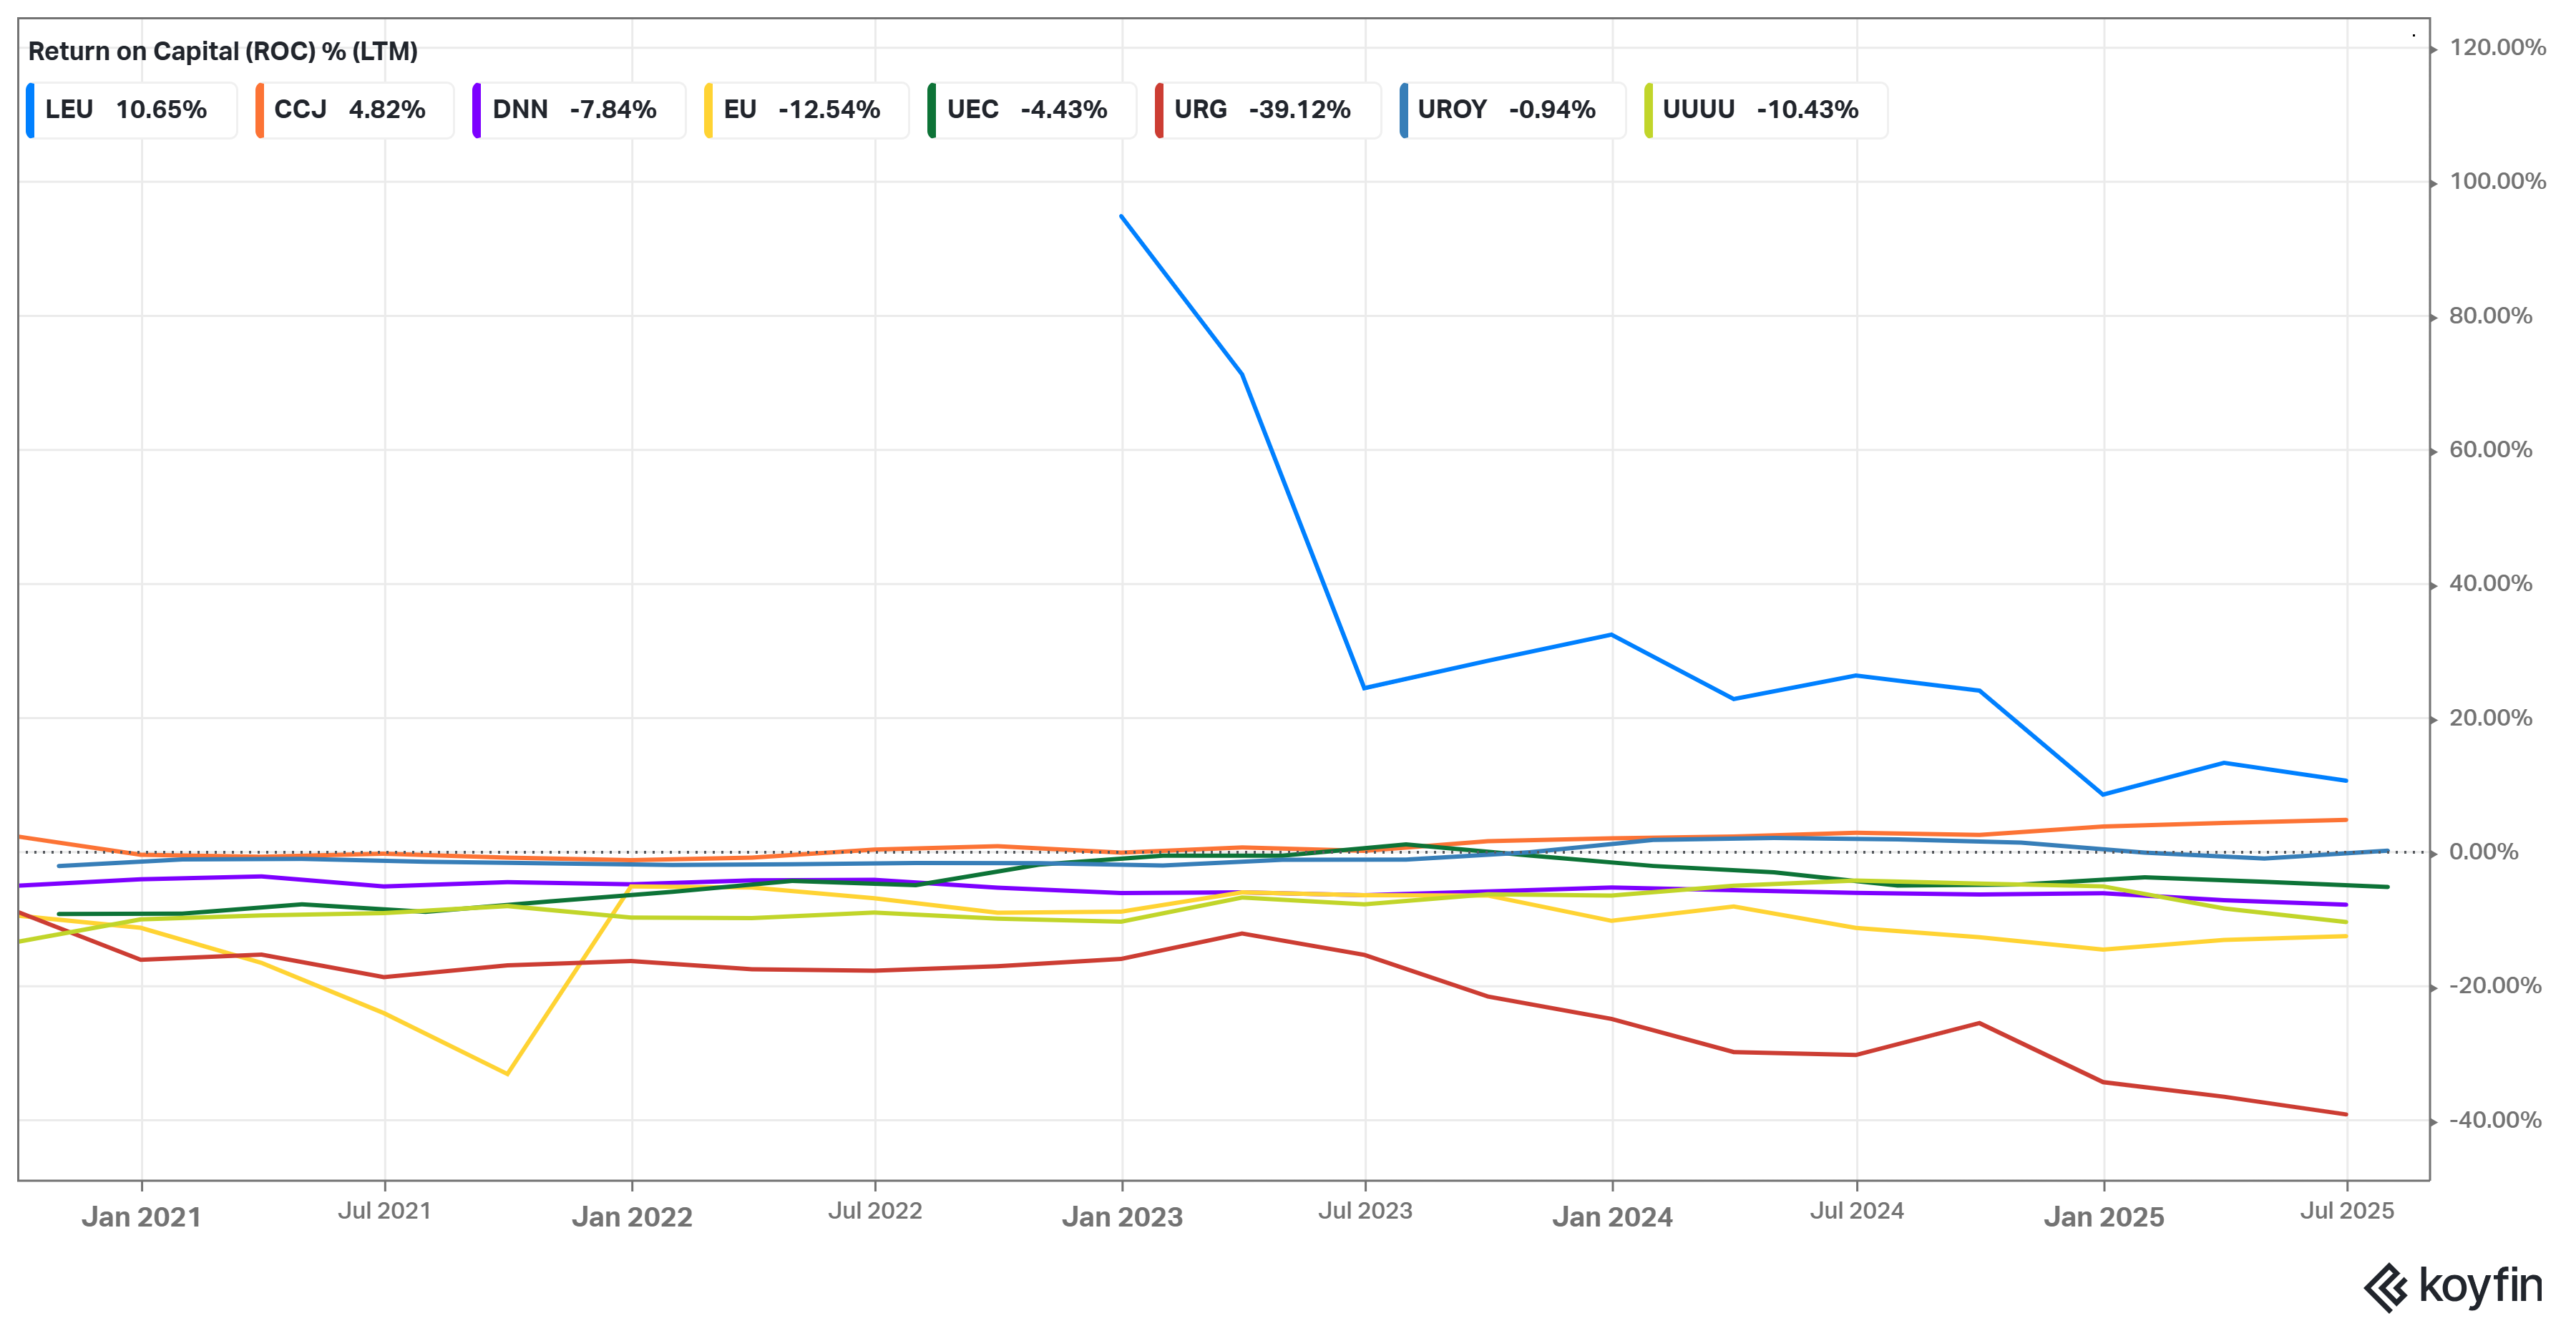
Centrus Energy (LEU) has the highest ROTC, about 10.7%. Centrus’s double-digit return on capital reflects its profitable enrichment contract work. Notably, Centrus’s ROTC spiked dramatically in 2022–2023 (exceeding 50% at one point, per the chart) when it began HALEU production under the DOE contract, then normalized to ~10%. A 10%+ return is healthy and indicates Centrus is earning solid profits relative to its capital – a result of its high-margin niche and low capital requirements (its AC100 cascade is a relatively small asset base generating significant revenue).
Cameco (CCJ) had a ROTC of ~4.8%. While modest, this is a positive return and is on an upward trend. Cameco’s return on capital improved as it returned to full production and higher uranium prices in 2022–2024. ~5% trailing return suggests Cameco is profitable but still ramping toward its full earning potential (the metric includes the large capital deployed in McArthur/Key Lake restart and the Westinghouse acquisition, which haven’t fully yielded returns yet). We expect Cameco’s ROTC to rise in coming quarters as Westinghouse earnings and higher sales volumes kick in.
All other surveyed companies show negative ROTC, indicating they are currently loss-making relative to capital employed:
Uranium Royalty Corp (UROY) was nearly break-even with -0.94% ROTC. Essentially zero, this reflects URC’s asset-light model where net losses are very small. URC had some profitable moves (like uranium sales), nearly covering its operating costs. A ~0% ROTC is actually relatively good among peers since URC has no producing assets – its slight loss means it almost earned back its overhead via royalty income and trading profits.
Denison Mines (DNN) had -7.8% ROTC, a negative return as expected for a developer that generates negligible revenue. Denison’s small revenues (from services and toll milling) don’t cover its project development expenses, leading to net losses (thus negative return). However, at -7.8%, Denison’s losses relative to its equity/capital are not extreme, implying it’s managing expenditures (many development costs are capitalized rather than expensed, also affecting ROTC).
Uranium Energy Corp (UEC) showed -4.4% ROTC. UEC has started generating some revenue (hence its ROTC is closer to zero than peers), but it’s still negative. The slight negative suggests UEC’s acquisitions and holdings (large capital base) haven’t yet translated to positive net income. It likely sold some uranium inventory at a profit (improving its return) but also had one-time costs (integration, etc.). As UEC ramps production, we’d expect this to turn positive; currently it’s in a transitional phase with small losses.
enCore Energy (EU) ROTC ~-12.5% indicates a more substantial negative return. enCore invested heavily (acquisitions of Alta Mesa, building wellfields) and has just begun revenue. The negative return reflects that returns from initial production (a few hundred thousand pounds in late 2024) have not yet offset corporate and financing costs. The ROTC chart shows enCore had a wild swing in 2021–2022 (it spiked extremely high possibly due to some revaluation or one-time accounting gain, then dropped), now settling in negative territory as operations normalize.
Energy Fuels (UUUU) and Ur‑Energy (URG) had quite negative ROTC: -10.4% for UUUU, -39.1% for URG. These two are U.S. producers that only recently restarted significant operations:
Energy Fuels at -10% is surprisingly high (less negative) considering its 2024 net income was negative (due to heavy investment in rare earth ramp-up). The moderately negative ROTC indicates it earned some gross profit (from vanadium/REE/uranium sales) but overall had a net loss when considering total capital. As its rare earth venture has not fully paid off yet and it’s still ramping mining, a negative return is expected – but -10% is not severe and should improve as revenues grow.
Ur‑Energy’s -39% ROTC is notably poor. This is likely because Ur‑Energy, despite making some sales in 2023–24, still had a net loss and it has a relatively small capital base, so losses weigh heavily. It also may reflect that Ur‑Energy carried a lot of idle capital (investment in Lost Creek and Shirley Basin) that wasn’t producing for much of the period, so return on that capital was deeply negative. Now that it has resumed production and has contracts, this should improve, but trailing 12-month figures still include the early part of 2024 when it was ramping up with costs outpacing revenue.
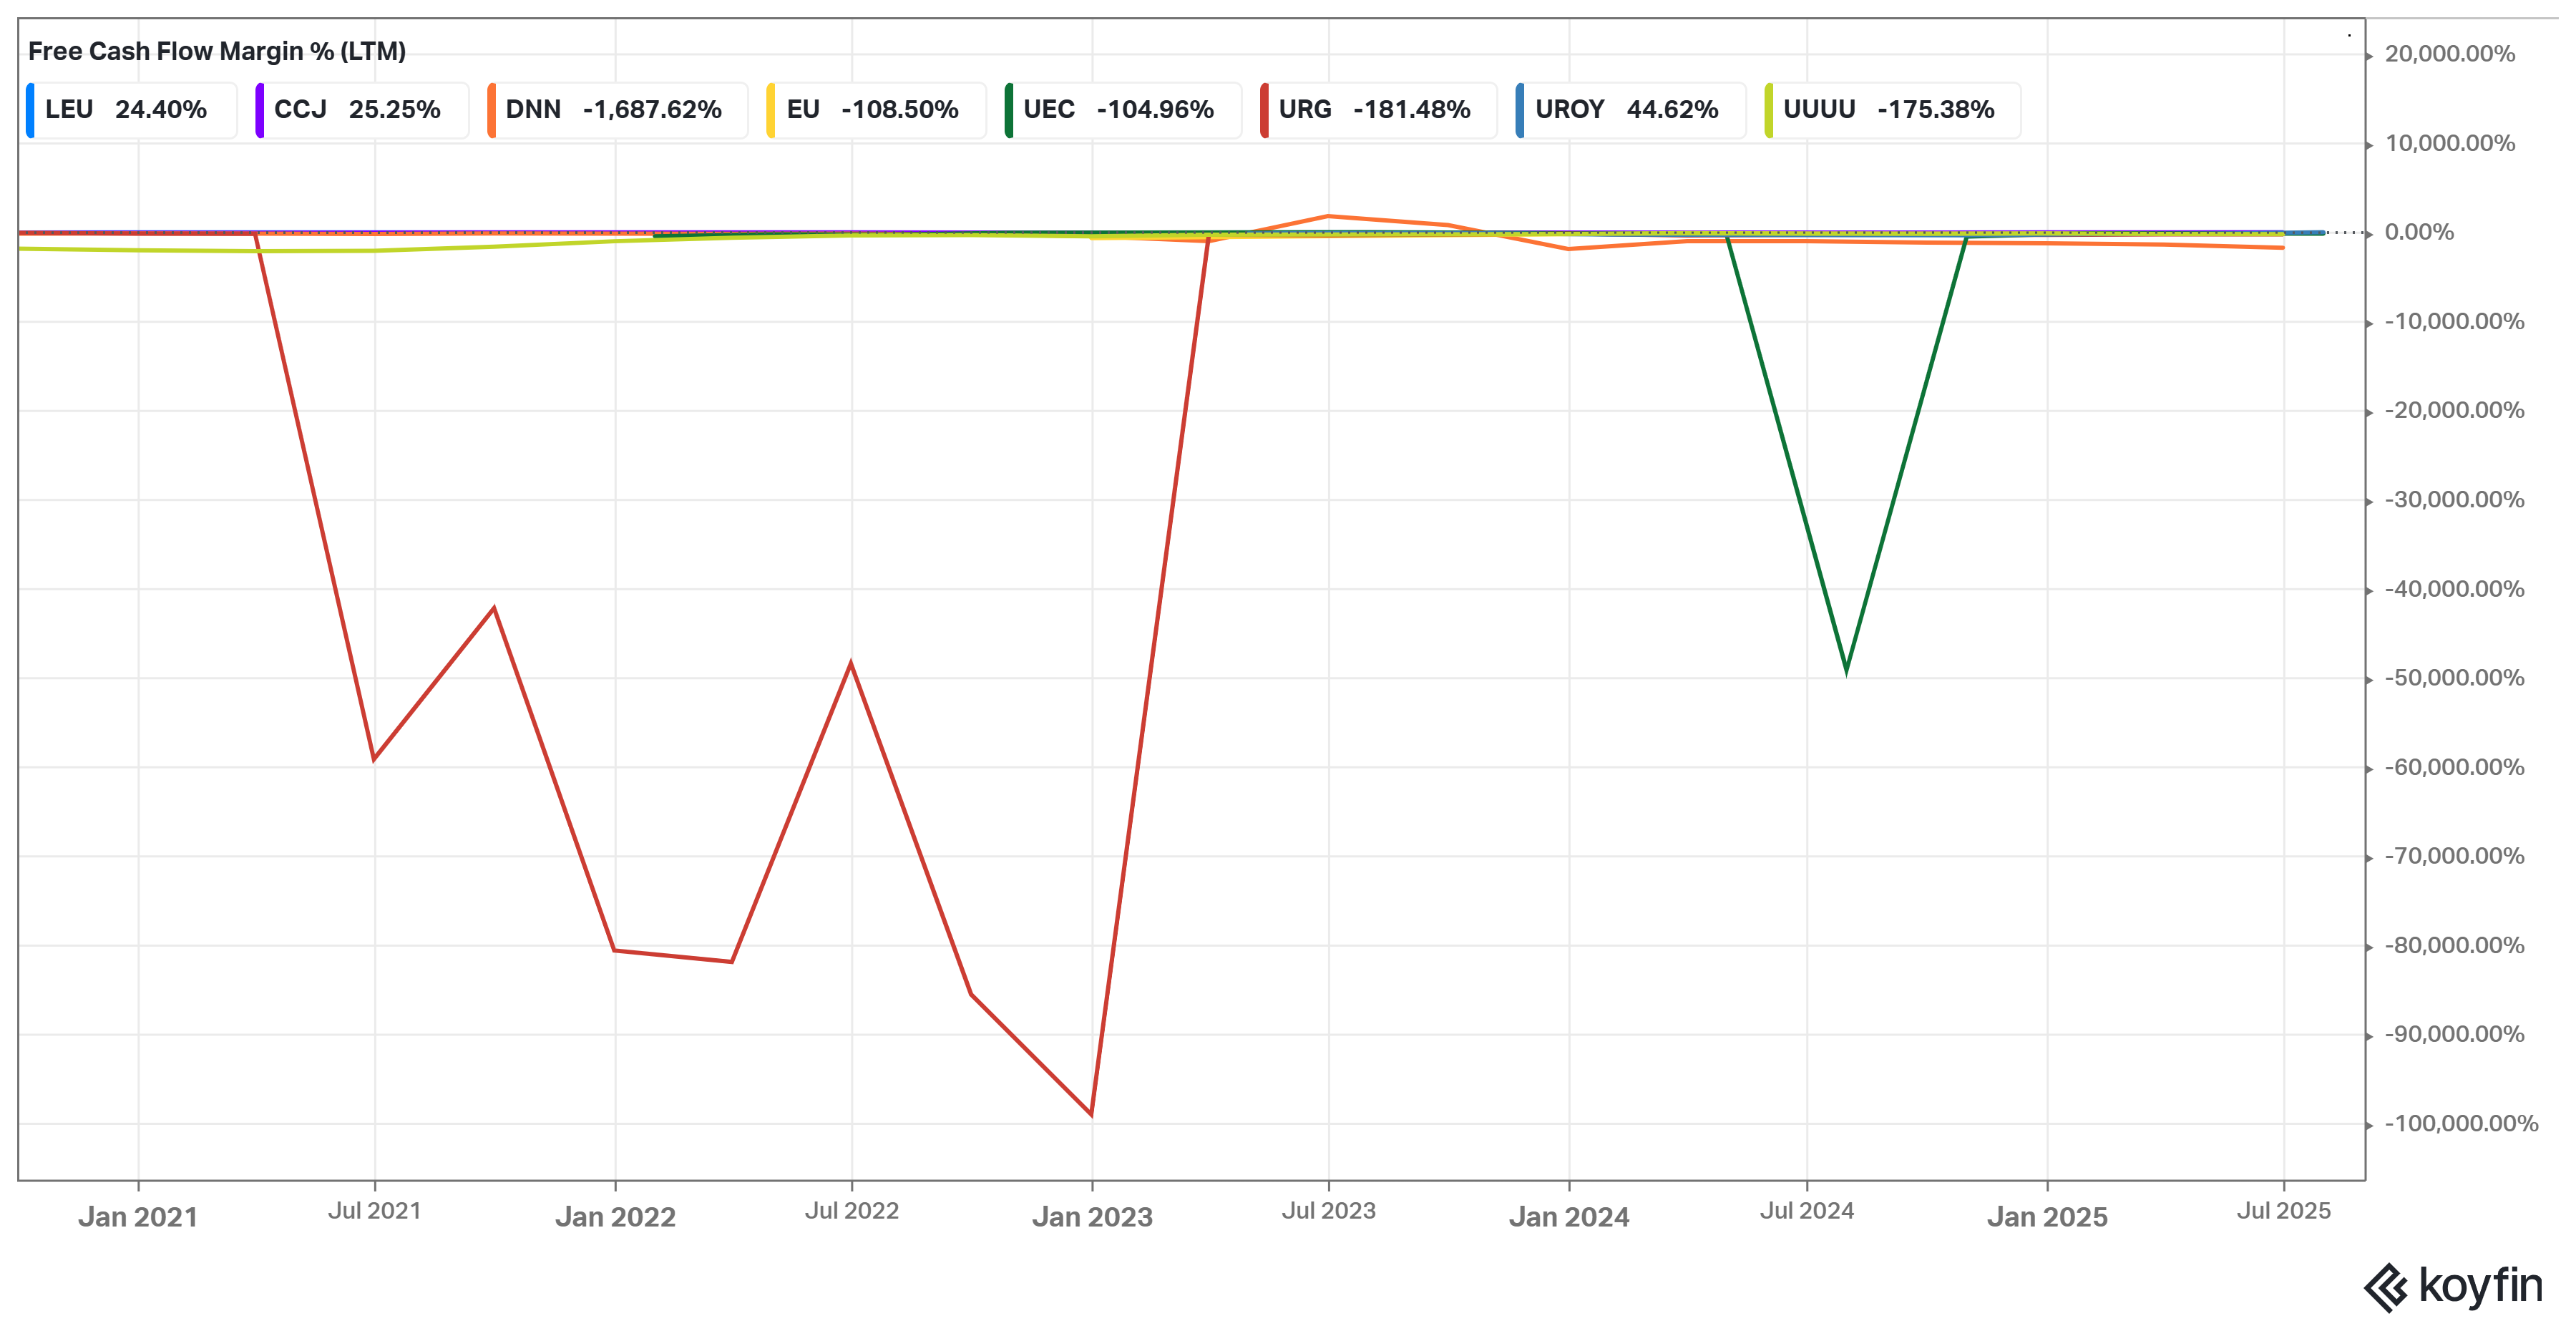
Uranium Royalty Corp (UROY) surprisingly shows a positive FCF margin of +44.6%. This indicates URC generated significant free cash relative to its revenue. How? Through selling some uranium inventory, while its expenditures (mostly G&A and small royalty/interest investments) were limited. URC has no capex (it doesn’t build mines), so its cash flow essentially equals operating cash after any royalty purchases. A 44% FCF margin is very high – it suggests that nearly half of its revenue was converted to free cash flow. This happened because URC liquidated some inventory at high prices in the period, bringing in cash. It’s worth noting this might not be recurring, but at least in the LTM period, URC was free cash flow positive and by a large margin.
Cameco (CCJ) has an FCF margin of ~25.3%. This is quite robust given Cameco’s heavy capital requirements (it was ramping McArthur and also investing in projects like Inkai expansion, plus the Westinghouse deal which would affect investing cash flows). Generating free cash flow of ~25% of revenue indicates Cameco’s operations not only cover all its sustaining capex but also produce substantial surplus cash. In 2024, Cameco had operating cash flow of C$905M and capex much lower, resulting in strong free cash. A 25% FCF margin places Cameco firmly in the “cash cow” category among uranium companies – it’s funding growth, paying dividends, etc., from internal cash generation.
Centrus (LEU) shows an FCF margin of ~24.4%. Similar to EBITDA margin, Centrus converts a good chunk of revenue to free cash. This reflects that its capex is relatively low (its major investment in HALEU centrifuges was co-funded by DOE). Centrus generated significant operating cash from its contracts and doesn’t have large sustaining capex like a miner would. Hence, ~24% of revenue becoming free cash flow – an excellent result, reinforcing that Centrus’s business is asset-light and profitable. It likely used cash to pay down debt or build a buffer.
All other companies had negative FCF margins (burning cash):
Denison (DNN): FCF margin a whopping -1688% (!). This outsized negative indicates that Denison’s capex on Wheeler River and other projects vastly exceeds its tiny revenue. For example, Denison’s revenue might be on the order of a few million, but it’s likely spending tens of millions on project development per year, leading to an FCF loss far larger than sales. That -1688% is extreme – essentially Denison is in heavy investment mode (which is expected; it’s raising cash via equity and JV arrangements to fund its project). This underscores that developers have enormous cash burn relative to any minor operating income.
enCore (EU): FCF margin -108.5%. enCore’s negative FCF is a bit more than its revenue (meaning it spent a bit more than double its revenue in free cash outflow). enCore did generate some revenue from Alta Mesa in late 2024, but it also had capital outlays – possibly completing Alta Mesa’s refurbishments and drilling new wellfields, plus the Boss Energy deal. The -108% suggests enCore’s cash burn is only slightly larger than revenue – which might imply that if it doubles revenue, it could approach free cash flow neutrality (provided capex doesn’t also jump). It’s actually less severe than some peers, perhaps because enCore timed Alta Mesa restart to quickly get some cash flow.
Uranium Energy Corp (UEC): FCF margin -104.9%. UEC’s free cash outflow is about equal to its revenue, meaning it’s burning cash roughly at the same rate it’s bringing it in. UEC has been spending on exploration, development (Christensen Ranch restart, Burke Hollow drilling), and also acquisitions (though acquisitions are cash outflow in investing, not in “capex” per se). The margin indicates UEC is still consuming cash to fund growth, but not at an order-of-magnitude higher level than its revenue – partly because it did monetization (like selling some inventory) to offset some spending. Still, it’s in negative territory – not self-funding yet.
Ur‑Energy (URG): FCF margin -181.5%. URG’s cash burn is about 1.8 times its revenue. This aligns with the fact that in 2023–2024, Ur‑Energy was constructing Shirley Basin (capex) and ramping Lost Creek (operating costs above revenue initially). It also invested in expanding wellfields. Those capital and development expenses made it deeply free cash flow negative despite starting to have sales. Ur‑Energy did raise equity to cover these needs. We expect this margin to improve now that Lost Creek is producing and much of Shirley’s initial capex is done, but as of LTM it’s heavily negative.
Energy Fuels (UUUU): FCF margin -175.4%. Energy Fuels similarly spent a lot more cash than it earned. In 2024, its operating cash flow was negative (though improved) and it had capex related to rare earth separation infrastructure and mine development (Pinyon Plain, etc.). It also have increased working capital buying monazite sands etc. The result: a large free cash outflow relative to revenue. However, Energy Fuels had a strong cash treasury from past asset sales and stock issuance, which it’s deploying. As its rare earth and uranium sales grow, this gap should close. The trend already in 2024 was improvement (the margin was even worse in 2022 when it had minimal revenue but was building its REE circuit).
🥇 Conslusion - Leaders, High-Upside, and Weak/Volatile Players
Based on their financial performance, strategic positioning, and risk profiles, the peer companies can be categorized into three groups:
Capital-Efficient, Cash-Generative Leaders:
These are companies with established operations, strong balance sheets, and the ability to consistently generate cash and returns. They efficiently deploy capital and have relatively low-risk profiles in the uranium sector.
Cameco Corporation (CCJ): The flagship producer. Cameco stands out as a leader with tier-one assets, positive earnings, and robust cash flows. It has a ~27% EBITDA margin and ~25% FCF margin – indicating healthy profitability and internal funding capacity. Cameco’s strategy of production discipline and long-term contracting has paid off, giving it stable revenue and an upward earnings trajectory as uranium prices rise. It is capital-efficient – having restarted McArthur River within budget and timing – and is now reaping the benefits in a tightening market (e.g. 2024 cash from operations was $905M, a testament to its cash generation). Cameco’s diversification into conversion and its 49% stake in Westinghouse add further stable revenue streams. As one of the lowest-cost producers globally (due to high-grade mines) and with a 220 Mlb contract backlog, Cameco is positioned to lead the industry in earnings and cash flow. It has the scale, market influence, and financial resilience (ample liquidity, manageable debt) that others lack. All these factors place Cameco firmly in the “leaders” category – it is capable of funding growth projects and returning value to shareholders (e.g. via dividends) out of operating cash. In short, Cameco is the prototypical “cash-generative leader” in uranium.
Centrus Energy Corp. (LEU): The niche enrichment cash cow. Centrus, though much smaller than Cameco, has demonstrated an impressive ability to generate profits and cash from its specialized enrichment services. Its ~23% EBITDA margin and ~24% FCF margin show that Centrus runs a lean, profitable operation. The company’s unique position – being the only U.S. HALEU/enrichment supplier – grants it a near-monopoly in a high-value niche, allowing strong pricing power and government-backed revenue. Centrus requires relatively low capital to expand (especially with DOE funding support), so a large portion of its earnings translate to free cash. It earned a 10.7% ROTC, highest of the peer group, reflecting effective use of capital. Centrus has also been using cash to reduce debt, further solidifying its financial footing. Given its predictable contract with DOE (extended through 2026) and potential new commercial HALEU contracts, Centrus is set to continue being cash-generative. It is “capital-efficient” in that it doesn’t need multi-hundred-million-dollar mines – its investments in centrifuges are modest relative to the revenue they produce. This results in a strong free cash profile. Thus, Centrus qualifies as a cash-generative leader, albeit in the fuel services segment rather than mining. It offers a combination of steady cash flow, high margins, and a protective market position that most peers do not have.
These companies are best positioned to weather uranium market fluctuations and capitalize on upswings. They have strong cost positions, positive cash flow enabling self-funded expansion or shareholder returns, and typically lower risk (operationally and financially). They tend to be the “go-to” investments for exposure with relative safety. Their structurally higher margins and returns (as evidenced by metrics) put them ahead of the pack.
Growth-Focused Companies with High Upside Potential:
This category comprises companies that are aggressively pursuing growth – often by developing new projects or scaling up production – and thus offer significant upside if successful. They typically sacrifice short-term earnings for future gains. They have high resource leverage and could become much larger producers, translating into dramatic revenue (and stock valuation) increases if all goes to plan. However, they carry execution and financing risks.
NexGen Energy Ltd. (NXE): High-grade mega-project poised for transformative growth. NexGen is not yet producing, but it arguably has the largest upside among peers due to its Arrow deposit – one of the world’s biggest and highest-grade undeveloped uranium resources. If Arrow (Rook I project) is built (likely by 2027–28), NexGen could produce 25–30 Mlbs U₃O₈ annually – that is on par with Cameco’s total output, effectively catapulting NexGen to major-producer status. Its market positioning is growth-centric: it’s in late-stage permitting and financing, with substantial support from strategic investors (e.g. its partnership with Shaw/CEF). NexGen’s upside potential lies in Arrow’s projected low cost (thanks to ~3% average grades) and huge scale – the project’s economics show an extremely high NPV and IRR at even moderate uranium prices. NexGen has been raising capital via equity and a $110M debenture, which should carry it through initial construction phases. As a pre-revenue company, NexGen’s current financials are negative – but the market values it for the future cash flows from Arrow’s ~234 Mlbs reserves. If uranium prices are strong and Arrow comes online, NexGen’s revenue would go from $0 to potentially billions of USD annually (e.g. 25 Mlbs * $70 = $1.75B). That kind of growth – effectively from zero to one of the top three producers worldwide – defines “high upside potential.” The risks: large capex (~$1B), project execution in remote Saskatchewan, and market price risk. But given the deposit quality and the strategic importance (even WNA notes it could supply a quarter of world needs), NexGen is a growth-focused company that could yield outsized returns if it successfully transitions to production.
Denison Mines Corp. (DNN): Innovative developer with multiple growth drivers. Denison is squarely focused on growth via its Wheeler River project (Phoenix and Gryphon deposits). It has embraced a novel ISR mining method for Phoenix, which, if successful, could make Phoenix one of the lowest-cost uranium mines globally. Denison’s upside comes from two angles: (1) Phoenix ISR – a high-grade (average ~19% U₃O₈) deposit that in the PFS is projected to produce ~6 Mlbs/yr at extremely low costs (cash costs <$10/lb) using ISR. This could generate strong cash margins even at mid-level uranium prices, turning Denison into a producer with robust earnings in a few years (target production around 2026–27). Resource leverage – aside from Phoenix, Denison has Gryphon (another ~7 Mlbs/yr potential via conventional mining later) and holds 95% of Wheeler, plus other JV assets in Athabasca. Its interest in the McClean Lake mill (22.5%) could also facilitate growth by processing ore from new discoveries. In short, Denison has multiple growth projects in the pipeline, not just one. Financially, Denison currently loses money and spends heavily (EBITDA margin ~-155%), but it has a treasury bolstered by strategic investors (e.g. a large position by Korea’s KHNP) and monetizations (like the APG stream). If Phoenix ISR works as intended, Denison could evolve from a negative-cash-flow explorer to a 200+ employee producer with millions of lbs sold annually, within the later 2020s. Given Wheeler’s total resource (~300 Mlbs) and Athabasca grades, Denison’s growth potential is high – it could in time rival mid-tier producers. The upside comes with technical risk (ISR in hard rock is new), but recent field tests have been promising. Overall, Denison’s multi-asset growth portfolio and potential for first-quartile production costs position it as a high-upside, growth-oriented company.
Uranium Energy Corp. (UEC): Aggressive consolidator aiming to be a top producer. UEC has adopted a growth-by-acquisition strategy, accumulating the largest resource base of any U.S. company and significant Canadian assets. It now has an extensive pipeline of projects: operating ISR facilities in Texas and Wyoming (Palangana/Hobson, Christensen/Irigaray), mid-stage projects (Burke Hollow, Reno Creek) and long-term high-grade projects in Canada (Roughrider, Shea Creek via UEX). UEC’s vision is to become a “multi-jurisdictional producer” with >5–6 Mlbs/year output across its facilities. Recently, UEC began production in Wyoming (Christensen Ranch in 2024) and could ramp up Texas ISR if it chooses, meaning in the next couple of years it could be producing on two fronts. Over a 5-year horizon, if market conditions allow, UEC might bring on additional ISR projects sequentially – e.g. Burke Hollow (licensed), then Reno Creek (largest permitted pre-construction ISR in U.S.), etc. On top of that, UEC’s acquisition of UEX gave it the Roughrider development project in Canada – a high-grade 6.5% deposit of ~58 Mlbs that has an economic study pointing to ~2.7 Mlbs/year production potential. UEC’s strategy is clearly growth-focused: it intentionally held physical uranium (~5 Mlbs inventory at one point) to both support prices and as a hedge to accelerate cash flow; it has done two major acquisitions in 12 months (Uranium One Americas and UEX) to double its resource base; and it’s now working to turn these assets into output. Its current finances are negative (EBITDA margin -103%), and it’s spending cash on development (FCF margin ~-105%), but it has over $100M cash (raised during high uranium price period) and zero debt, giving it runway. If UEC executes, in 5 years it could realistically be producing, say, 1 Mlb/yr in Texas, 1–2 Mlbs/yr in Wyoming, and be advancing Roughrider which could add ~5 Mlbs/yr by late decade. That would make it a significant mid-tier producer with diverse operations – fulfilling its growth thesis. UEC’s upside lies in leveraging its broad asset portfolio to become one of the largest western uranium producers (especially filling the U.S. domestic supply gap), which would likely dramatically increase its revenues and possibly attract strategic partnerships (e.g. utilities or government support). Given the scale of resources it controls (~226 Mlbs measured+indicated across U.S./Canada after acquisitions), UEC has high leverage to uranium price – if it can turn those resources into production, the growth in enterprise value could be substantial. In summary, UEC’s aggressive growth orientation and large asset pipeline give it high upside potential, albeit with the integration and execution risks inherent in its rapid expansion approach.
enCore Energy Corp. (EU): Fast-ramping ISR newcomer with multi-project growth. enCore has swiftly transformed from an explorer to a producer by acquiring and restarting multiple ISR facilities. It is very much focused on growth through rapid production ramp-up and project development. In 2023–2024 alone, enCore: reopened the Rosita plant (produced first pounds mid-2023), acquired and restarted the Alta Mesa plant (producing Q4 2024), and advanced two sizable pipeline projects (Dewey-Burdock and Gas Hills). As of early 2025, enCore is already the second-largest uranium producer in the U.S. (Q4 2024) and expects to double Alta Mesa’s capacity in 2025. Its strategy is to grow production volume quarter by quarter. The upside is that enCore could reach 1 Mlb/year combined output in Texas in 2025 (Rosita+Alta Mesa) and then further boost total production toward ~2–3 Mlbs/year by bringing on Dewey-Burdock (licensed, could be online by ~2026) and Gas Hills (~2027). If all assets are developed, enCore has stated goals of being a top domestic producer. On top of organic growth, enCore has shown it’s opportunistic with M&A (it bought Alta Mesa for $120M, and earlier acquired Azarga). Financially, enCore is still loss-making (as expected early on), but it secured a $70M financing from industry partner Boss Energy to help fund growth – a vote of confidence in its production plans. The company’s nimble approach (quick restarts, small-team execution) means it achieves cash flow earlier than many – indeed enCore already had ~$9M revenue in 2024. The market is likely valuing enCore for what it could produce in a couple of years (multiple millions of lbs), which is a large jump from near-zero in 2022. Given the established nature of ISR mining and enCore’s track record (hitting production timelines in 2023), the execution risk is moderate and upside in an $70+/lb uranium environment is considerable – enCore could generate significant free cash when fully ramped (ISR operations typically have low operating costs and moderate capex). Therefore, enCore squarely fits the “growth-focused, high upside” category – it is scaling up aggressively and if uranium prices hold, its cash flow and size as a company will increase correspondingly, potentially rewarding investors with a re-rating as it transitions from junior to mid-tier producer.
Energy Fuels Inc. (UUUU): Diversified growth via uranium and rare earths. Energy Fuels’ growth story is twofold: ramping uranium output from its portfolio of standby mines, and expanding into rare earth element (REE) processing. It is arguably the most entrepreneurial of the U.S. uranium companies, repurposing its White Mesa Mill into a critical minerals hub. On the uranium side, Energy Fuels has multiple conventional projects (Pinyon Plain, La Sal, others) that it began restarting in 2022–2024, achieving the highest U.S. uranium production in Q4 2024. It plans to further increase uranium output in 2025 by adding wellfields at Nichols Ranch (ISR) and mining its inventory of high-grade ore (one example: Pinyon Plain stockpiled ore to process after transport agreements). While its sustainable uranium output might be a modest ~0.5–1 Mlbs/year given its asset base, it has upside through many small mines and the unique ability to process alternate feeds (like cleanup material or purchased ores) at White Mesa for additional uranium. More transformative is its Rare Earth Elements initiative: Energy Fuels is already producing a mixed REE carbonate (it supplied 233 tonnes in 2022 to Neo Performance). It’s constructing REE separation infrastructure to move further down the value chain – aiming to produce separated NdPr oxide by 2026. If successful, Energy Fuels could tap into the multi-billion-dollar rare earth market, which would be a huge new revenue stream unrelated to uranium prices. The company has secured monazite supply agreements and even acquired a heavy sand project in Brazil to ensure feed. The upside here is significant: for instance, one projection suggests Energy Fuels could generate > $100M annual revenue from rare earth products at full capacity, which is on par with its potential uranium revenue. Essentially, Energy Fuels is positioning to grow not just as a uranium miner but as a vertically-integrated critical minerals producer (uranium + vanadium + rare earths). This growth strategy carries high upside (it could command a higher valuation if it captures part of the REE market presently dominated by China) but also complexity and execution risk (the metallurgy and market development for REEs are not trivial). Financially, Energy Fuels is still loss-making and cash-flow negative as it invests in these growth projects, but it has over $100M in working capital and no debt, giving it flexibility to fund growth internally for some time. The company’s share price performance often tracks uranium sentiment, but its diversified approach means it has multiple pathways for upside. If uranium prices surge, its idled mines quickly become profitable (and it holds a few hundred thousand pounds inventory it can sell at a premium); if rare earth initiatives succeed, it opens a whole new investor audience and revenue source. Due to this multipronged growth focus, Energy Fuels can be viewed as a growth-oriented company – less about immediate steady cash generation (it even withheld uranium sales in early 2025 to wait for better prices) and more about building long-term high-value businesses. In summary, Energy Fuels’ willingness to pivot and invest for future gains, along with its unique asset (White Mesa Mill) that underpins these plans, give it substantial upside potential if its bets pay off – albeit with higher volatility and execution complexity.
Ur-Energy Inc. (URG): Established ISR miner refocusing on growth. Ur-Energy was a small producer that went into survival mode when prices were low, but now it is firmly shifting back to growth by ramping Lost Creek and constructing Shirley Basin. Its upside comes from the fact that it can rapidly increase production with modest capex now that contracts and prices justify it. Ur-Energy has guided that Lost Creek can scale up to ~1 Mlb/year (from essentially zero in 2021) and Shirley Basin will add ~0.9 Mlb/year by 2026. Combined ~1.7–1.9 Mlbs/year by 2026 would make Ur-Energy one of the top 3 U.S. producers. While that volume is lower than enCore or UEC’s aspirational targets, for Ur-E (which in 2018 produced only ~0.3 Mlbs) it’s a big growth. Importantly, Ur-Energy already locked in multi-year sales contracts up to 1.3 Mlbs/year through 2030 at good prices, virtually ensuring it has buyers and cash flow for its expanded production. This de-risks its growth – it won’t need to find customers or worry about spot market at least for that contracted portion. So Ur-Energy’s growth is somewhat “baked in” barring operational issues. With existing infrastructure and permits, it is a relatively low-risk growth story compared to a greenfield developer. The upside is that as a small-cap company, increasing output and revenue 5-10x over a few years (from 0.28 Mlbs sold in 2023 to perhaps ~1.5 Mlbs by 2027) should significantly boost earnings and could re-rate the stock. The current negative returns/margins will flip to positive as fixed costs are spread over more pounds – presumably pushing Ur-Energy into the class of self-sustaining producers. Among U.S. ISR peers, Ur-Energy is unique in that it has new contracts in hand and a fully funded project (Shirley’s capex is low and mostly funded), making its growth pipeline quite credible. While its ultimate scale is lower than, say, UEC’s potential, its execution certainty and nearer-term cash flow give it a solid growth profile. Therefore, Ur-Energy belongs in this category as a growth-focused company – its management is clearly prioritizing ramping production to meet contracts and capturing the current market upswing, and the upside will be realized as it goes from effectively zero revenue two years ago to tens of millions annually in the next couple years.
Companies to Avoid (Structural Weakness or Excessive Volatility):
This category includes companies that, relative to peers, exhibit structural disadvantages, unsustainable models, or high exposure to risk factors that make them less attractive in the long run. Such companies might underperform even if uranium prices rise, due to inherent issues in their assets, strategy, or financial structure.
IsoEnergy Ltd. (ISO) / Anfield Energy (AEC): Early-stage explorers with high funding needs and uncertain timelines. IsoEnergy on its own is an exploration play (notably the Hurricane deposit). While high-grade, Hurricane is not yet at PFS stage and would require a new mill or toll milling solution, meaning commercial production is many years off (late 2020s at best). It generates no revenue and continually needs capital (dilution risk). Its strategic move to acquire Anfield (Shootaring Canyon mill and U.S. projects) in late 2024 adds potential near-term production, but also complexity. The combined IsoEnergy-Anfield entity will inherit Anfield’s assets that have historically struggled to advance: Shootaring mill is 40 years old and requires refurbishment and regulatory approval to restart (not a trivial or cheap task), and Anfield’s U.S. mines (Velvet-Wood, West Slope) are relatively small and also need significant capital to develop. Even with fast-track permitting, these projects face an uphill battle (Anfield’s prior inability to finance them is telling – it ended up being acquired). IsoEnergy does have strong backers (majority-owned by NexGen), but it will likely have to raise a lot of funding to refurbish the mill (~$25M+ perhaps) and to develop mines. There is execution risk in integrating Anfield’s team/assets and delivering on promises. In the interim, it’s burning cash (no income; IsoEnergy’s EBITDA margin was deeply negative because zero revenue). Structurally, IsoEnergy lacks any existing cash flow and is essentially a junior explorer turned developer; these are inherently risky as they rely on market financing and project success to eventually see payoff. Given its small size and big plans, IsoEnergy has a high volatility profile and significant dilution risk. If uranium prices or equity markets wobble, it could struggle. Until it proves it can actually restart Shootaring and produce uranium, it sits in the speculative category. Thus, cautious investors might avoid IsoEnergy (and similarly Anfield) until it shows tangible progress. The potential is there (it aims to be a near-term U.S. producer), but the hurdles and need for flawless execution are high. In short, it’s structurally weak now (no revenue, dependency on external funding) and the path to becoming a sustainable producer involves considerable risk – making it less attractive compared to peers with clearer near-term cash generation.
Uranium Royalty Corp. (URC): Volatile revenue model tied to uranium price swings and third-party performance. Uranium Royalty has an appealing concept (royalties on top-tier mines), but in practice its revenues are small and erratic, and it remains effectively an asset play vulnerable to uranium price volatility. For instance, FY2024 it might have had a one-time gain selling uranium (hence positive FCF), but going forward its royalty income alone is modest – maybe a few million per year unless uranium prices soar or new mines come on. In fact, its forward revenue is projected to drop -71% precisely because it had an exceptional sale that won’t recur and because some mines (like Cigar Lake Phase 1 royalty) are winding down. URC’s earnings will likely be negative until more royalties are paying or until it sells more inventory at a profit – essentially it’s a bet on uranium price increases and project developments over which it has no control. Structural weaknesses include:
No control over assets: URC’s fate is at the mercy of operators like Cameco, Paladin, etc. If a project is delayed or shut, URC’s royalty goes to zero. E.g. it had royalty on Langer Heinrich that paid nothing for years until Paladin finally decided to restart (which is happening now). This passive model introduces risk – if one royalty fails, URC can’t do anything.
Dilution risk: URC might issue shares to acquire more royalties (it did financing to buy the McArthur River royalty). If the market isn’t favorable, such deals could be dilutive.
While URC has potential (e.g. if McArthur River ramps to full, that royalty brings steady revenue, or if it monetizes inventory at peaks), it’s not a sure bet. The structural volatility – revenue heavily sensitive to uranium spot price and irregular transactions – makes it less predictable or stable. In down markets, URC’s revenues could shrink to near-zero (as royalty % on sales drop with price, and no one to sell inventory to profitably).
Given these, some investors may avoid URC or see it as riskier than producers with locked-in contracts. Although we noted URC’s efficiency in Section 10, it belongs here too because from a different angle, it’s the most volatile earnings profile: e.g. one quarter it can have a gain from selling uranium, next quarter nothing, etc. That unpredictability and reliance on others’ production is a structural weakness relative to self-operated producers who can at least try to optimize their output or hedge accordingly.
Energy Fuels Inc. (UUUU): Diversified but highly volatile and complex operations. Energy Fuels could arguably fit in any category (it has growth potential, but also structural quirks). We include it here as well because of its operational volatility and the uncertainty around its new ventures:
Historically, Energy Fuels’ financial results have been extremely volatile: one year it sells a chunk of vanadium from tailings and is profitable, the next year it has no sales and is deeply negative; it swings from producing uranium to waiting on standby, etc. This volatility in execution is partly strategy (they time sales to price) but it makes the company’s performance erratic and hard to forecast. For an investor who wants steady exposure, Energy Fuels is somewhat unpredictable.
Structural complexity: Managing a conventional mill, ISR wellfields (Nichols Ranch), multiple small mines, plus entering a whole new industry (rare earth processing) is a lot for a company of its size (<$1B market cap). There’s execution risk that management might be stretched thin or capital allocated sub-optimally (jack of all trades, master of none concern). Its rare earth business, while promising, is far from guaranteed success – it competes against established Chinese supply chains, and faces technical scale-up risks. If rare earth economics disappoint or uranium prices don’t rise enough, Energy Fuels could end up in a tough spot after investing heavily.
Cash burn and dilution: As noted, Energy Fuels is burning cash (FCF margin -175%). It has issued equity multiple times to fund its rare earth foray. If these investments don’t yield timely cash flow, more raises could occur, diluting shareholders in a downturn.
High-cost operations when at low utilization: Its conventional mines need ~$50+ uranium to be economic, and the mill has high fixed costs if run below capacity. If uranium prices stagnate in the $50s (bearish scenario), EF could struggle to justify running its mines, leaving it reliant on alternate feed or rare earth which might not fully cover costs.
Volatile stock: EF’s share price tends to amplify uranium market moves, partly due to retail investor popularity and meme-stock type behavior at times. This means large swings – e.g. it soared in early 2021 with SPUT buying news more than fundamentals justified. That volatility can be off-putting to risk-averse investors.
Given these factors, Energy Fuels might be categorized as one to approach with caution (or “avoid” for conservative investors) due to its complex, volatile nature. While it has high upside, it also embodies higher risk and many moving parts that could go wrong (from metallurgical issues with REE separation to community pushback on ore trucking as was nearly an issue at Pinyon Plain).
Investors who prefer focused uranium plays or stable producers might avoid Energy Fuels’ rollercoaster and wait to see proof of sustained profitability in either uranium or rare earth segments.