
Marathon Petroleum Corporation (NYSE:MPC) | Valero Energy Corporation (NYSE:VLO) | Phillips 66 (NYSE:PSX) | HF Sinclair Corporation (NYSE:DINO) | PBF Energy (NYSE:PBF) | CVR Energy, Inc. (NYSE:CVI) | Delek US Holdings (NYSE:DK) | Par Pacific Holdings (NYSE:PARR)
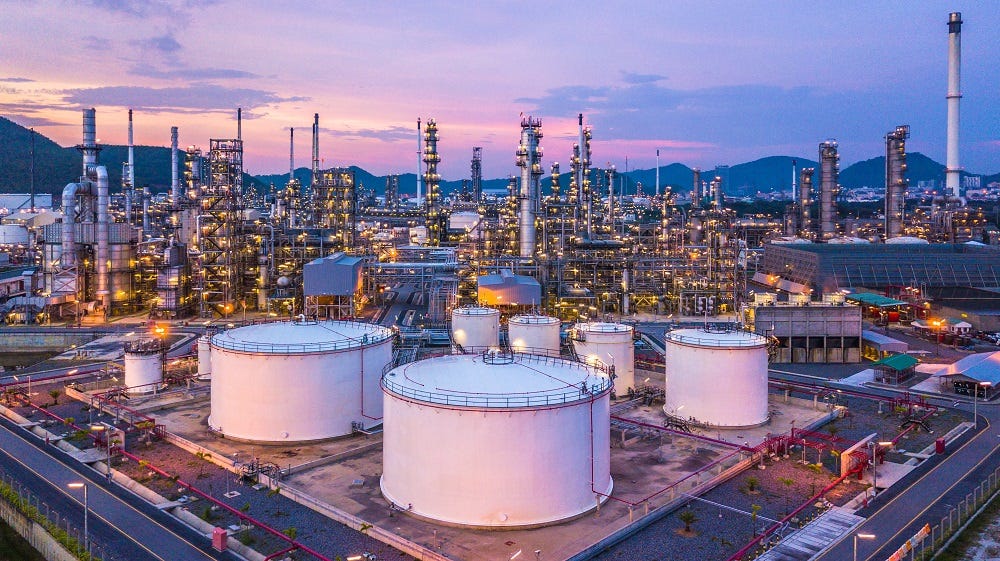
The traditional petroleum refining industry processes crude oil into finished petroleum products such as gasoline, diesel fuel, jet fuel, heating oil, and petrochemical feedstocks. Refining is a critical mid/downstream link in the energy value chain – sitting between crude oil production (upstream) and product distribution/marketing (downstream). U.S. refineries collectively produce enormous volumes of transportation fuels: gasoline, diesel (and other fuel oils), and aviation fuel together account for over 84% of U.S. refinery output. These fuels power vehicles, aircraft, ships, and industry, underscoring refiners’ essential role in the domestic and global economy.
U.S. refining capacity (≈17–18 million barrels per day) is the largest in the world, and the U.S. has been a net exporter of refined petroleum products since 2010. Major refining centers are clustered near oil import/export hubs – e.g. the Gulf Coast (Texas/Louisiana) and California – to access crude supplies and ship products. Most large refineries are near ports or pipelines for efficient feedstock supply and fuel distribution. The industry’s scale and sophistication have given U.S. refiners a competitive edge globally, historically aided by access to relatively cheaper domestic crude and natural gas. (For example, the shale boom made U.S. West Texas Intermediate (WTI) crude cheaper than global Brent crude last decade, boosting U.S. refiners’ margins) U.S. refiners today supply not only domestic demand but also export significant fuel volumes to markets like Mexico, Europe, and South America.
From an economic standpoint, refining is a high-volume, low-margin, cyclical business. Profitability is largely driven by the “crack spread” – the margin between product prices and crude oil costs. Refiners are price-takers: they buy crude at market prices and sell fuels at market prices, so refining margins fluctuate with global supply-demand dynamics. During periods of tight fuel supply or cheap crude, margins expand; in glutted markets or high crude price environments, margins compress. The COVID-19 shock in 2020 exemplified the industry’s cyclicality – fuel demand and margins collapsed, causing many refineries to incur losses or even shut down. By contrast, the recovery and dislocations of 2022 (e.g. the Ukraine war) led to record-high refining margins, yielding windfall profits for refiners.
Refining is also capital-intensive and heavily regulated. Environmental regulations require substantial investment in emission controls and fuel quality upgrades (e.g. removing sulfur to produce ultra-low-sulfur fuels). These factors, plus lengthy permitting processes and high fixed costs, create high barriers to entry. In fact, no new large greenfield refinery has been built in the U.S. since 1976 – capacity growth has come only from expansions or debottlenecking at existing sites. Recently, environmental and market forces have even led to capacity reductions: older, smaller refineries have closed or been converted to biofuel plants. This contraction in refining capacity has tightened supply, especially in regions like the U.S. West Coast. Overall, the industry’s position in the value chain – between volatile crude prices and competitive fuel markets – means refiners must run highly efficient, large-scale operations to thrive through cycles.
🏭 Key Companies
Below we focus on U.S.-based public companies whose primary business is petroleum refining (i.e. “pure-play” or predominantly downstream refiners). We exclude integrated oil majors like ExxonMobil and Chevron, which, despite their sizable refining segments, derive a majority of earnings from upstream oil & gas production (making their business profiles less comparable). Each of the following companies generates the bulk of its revenue and profits from refining operations and associated downstream activities:
Marathon Petroleum Corporation (NYSE:MPC) – Leading U.S. Refiner with Integrated Logistics
Market Position: Marathon is the largest U.S. refiner by volume, with 13 refineries (mostly in the Gulf Coast and Midwest) and ~2.9 million barrels per day of crude capacity. It became the industry leader after its 2018 acquisition of Andeavor, which expanded Marathon’s reach to the West Coast. Marathon also owns the general partner and a ~65% stake in MPLX, a midstream logistics MLP, giving it an integrated pipeline, terminal, and storage network supporting its refineries. This integration provides operational and financial advantages – MPLX’s steady fee-based cash flows effectively subsidize Marathon’s refining business (MPLX’s distributions cover Marathon’s base capital needs and dividend). Marathon’s scale and integration make it a price-maker in some markets and help secure feedstock and distribution optionality.
Pricing Model: Marathon operates as a merchant refiner – it buys crude on the open market (no upstream production of its own) and sells refined products at market prices. Refined product pricing is market-based (e.g. gasoline rack prices linked to spot markets). However, Marathon’s integrated logistics and former retail assets gave it some margin insulation. Until 2021, Marathon also owned a large retail network (the Speedway gas station chain). It sold Speedway for $21 billion in 2021, but secured a long-term fuel supply agreement as part of the deal. Thus, Marathon still benefits from guaranteed volume off-take (7.7 billion gallons a year) to Speedway, effectively a cost-plus arrangement for those gallons. Outside of that agreement, Marathon’s product sales realize prevailing market prices. Marathon’s focus is on maximizing its refining margin per barrel – leveraging economies of scale and running discounted crudes where possible – rather than any cost-plus contracts.
Recent Strategic Actions: Marathon executed a transformative restructuring in 2020–2021 under pressure from activist investors. It divested Speedway (completed in 1Q21) and used the ~$16.5B after-tax proceeds for debt reduction and massive shareholder returns. Marathon launched a $10 billion share buyback after the sale, ultimately retiring ~30% of its shares and sharply boosting remaining shareholders’ value. It also invested in renewable fuels: Marathon is converting its Martinez, CA refinery into a renewable diesel facility via a 50/50 JV with Neste. This project repurposes a idled refinery to produce biodiesel and sustainable aviation fuel, aligning with low-carbon fuel standards. On the conventional side, Marathon has focused on efficiency and cost reduction rather than major expansions – it shut two smaller, less competitive refineries in 2020 (Martinez’s crude unit and Gallup, NM) as demand waned.
Valero Energy Corporation (NYSE:VLO) – Best-in-Class Operator Focused on Efficiency
Market Position: Valero is also a large U.S. refiner (15 refineries, ~3.2 million bpd capacity) and is renowned for its operational excellence and low-cost structure. Valero’s refineries are highly complex (e.g. many have coking units), enabling processing of cheaper heavy/sour crude grades into high-value fuels. The company has leading positions in the Gulf Coast and also operates internationally (Canada and UK). Valero has consistently outperformed peers on refining throughput margin – it has been the highest-margin U.S. refiner in 9 of the past 11 years. Notably, Valero managed to avoid any EBITDA losses even in 2020’s downturn, unlike many competitors. This resilience stems from superior cost control and asset quality. Valero also has a large ethanol production business and a joint venture in renewable diesel (Diamond Green Diesel), making it a diversified fuels producer (though petroleum refining remains ~90% of revenue).
Pricing Model: Like Marathon, Valero is a merchant refiner selling into commodity fuel markets – its gasoline, diesel, and jet fuel are priced based on market indexes. Valero does not have a company-operated retail network (it supplies Valero-branded independent stations), so it primarily captures the wholesale refining margin. The company’s strategy is to maximize margin by optimizing its crude slate and product yield. With its complex refineries, Valero can buy discounted feedstocks (e.g. medium sour or heavy oils) and still make high-spec products. It effectively operates on a market-based pricing model, but achieves above-market refining margins per barrel through its cost advantage and feedstock flexibility. Valero’s scale also gives it negotiating power in crude procurement and efficiency in distribution, though ultimately product pricing is dictated by market supply-demand.
Recent Strategic Actions: Valero has pursued a mix of disciplined internal investment and shareholder returns. It regularly invests in refinery upgrades that expand margin (e.g. coker and alkylation unit additions). A recent example is the Port Arthur coker project which increases heavy crude processing and diesel yield. Valero also expanded in renewables via its Diamond Green Diesel (DGD) joint venture, which opened a new 470 million gal/year renewable diesel plant in Texas in 2023. These projects bolster Valero’s long-term margin profile and adaptability to lower-carbon fuel demand. Concurrently, Valero has been consolidating industry capacity: rather than acquiring new refineries, it benefits from competitors’ closures. (For instance, Phillips 66’s planned closure of its Los Angeles refinery and another California refinery closure in 2025–26 will leave supply gaps that Valero can fill, boosting margins.) Valero has not hesitated to permanently shut or repurpose less efficient facilities – it converted its small Aruba refinery to a terminal years ago, for example.
Phillips 66 (NYSE:PSX) – Diversified Downstream & Midstream Player in Transition
Market Position: Phillips 66 was formed in 2012 via spin-off from ConocoPhillips and operates a diversified downstream portfolio: refining (~1.9 million bpd across 12 refineries), midstream pipelines and NGLs, chemicals (through CPChem JV), and marketing. While refining is a large segment, Phillips has a more balanced business mix than pure refiners – in recent years, midstream and chemicals contributed a growing share of earnings. This diversification provides more stable cash flow streams (midstream fees, chemical margins) but also means Phillips is not as purely focused on refining profitability, which has contributed to some underperformance relative to focused peers. Phillips 66’s refineries are geographically spread (Gulf Coast, Central Corridor, West Coast). Notably, it has some unique assets like the only refinery in Santa Maria, CA (though that is being shut/converted) and heavy-crude-focused refineries in the Midwest (which import Canadian crude). Overall, PSX is one of the “Big 3” independent refiners (with MPC and VLO) by size, but its diversification makes it a slightly different animal.
Pricing Model: Phillips 66’s refining segment is a merchant business selling into open markets (gasoline, diesel, jet fuel, etc. at market prices). However, Phillips benefits from vertical integration in certain value chains – for example, its pipeline network and export terminals can lower transportation costs for its refineries, and its marketing arm (brand licensee of Phillips 66®, Conoco®, 76® gas stations) ensures a steady outlet for a portion of production (though most of those stations are independently owned). This can resemble a cost-plus model for that portion: PSX refineries sell to branded marketers at a formula tied to market prices plus logistics costs. But by and large, PSX’s product pricing is market-driven. One notable aspect is PSX’s internal transfer pricing for its chemicals feedstocks: PSX refineries provide NGLs and naphtha to its CPChem chemical plants. Those transfers might be at market or cost, but that’s a small slice of throughput. In summary, PSX’s refining margins are determined by crack spreads and its efficiency – and unfortunately, its refining segment has chronically underperformed peers in margin and returns according to both analysts and activist investors. This underperformance suggests PSX may not be capturing as much margin per barrel as competitors like Valero (perhaps due to less efficient refineries or suboptimal crude sourcing), a situation the company has been trying to improve.
Recent Strategic Actions: Phillips 66 is in the midst of a strategic pivot under both internal plans and activist pressure. Management has emphasized improving refining operations (after years of promises to boost refining returns) and “portfolio optimization.” In 2022–2023, PSX made two major midstream acquisitions – buying the remaining public units of Phillips 66 Partners (its former MLP) and acquiring all of DCP Midstream (a natural gas NGL processor) – effectively doubling its midstream EBITDA to ~$4B. This bolsters stable earnings but also raised questions about capital allocation away from core refining. In refining, Phillips has taken steps to rationalize capacity: it permanently closed its Alliance, LA refinery in 2022 after hurricane damage, and is currently converting its Rodeo (San Francisco) refinery to renewable fuels by 2024 (shutting most petroleum processing there). These moves reduce its fossil fuel refining capacity by several hundred thousand barrels, but are meant to exit weaker assets and invest in future-oriented production (the Rodeo Renewed project will make ~50,000 bpd of renewable diesel). The company is also implementing $500+ million in cost reductions and efficiency initiatives across its operations.
Perhaps most significant, activist investor Elliott Management launched a board challenge in 2023–2024, criticizing PSX’s lagging stock performance and “malinvestment” in underperforming projects. Elliott has pushed for unlocking value, including a potential spin-off of the midstream segment to refocus Phillips as a pure downstream company and achieve a higher sum-of-parts valuation. In March 2025, Elliott nominated 7 directors, indicating serious pressure on PSX’s strategy. Phillips 66’s management has responded by highlighting improvements: record-high refinery utilization (98% in 2022) and product yield (88% light products), and increasing shareholder returns. Indeed, PSX has aggressively grown its dividend (3.6% yield, with dividend per share up over 180% since 2012) and continues share buybacks. Going forward, investors should expect Phillips to either streamline (possibly separating midstream or other assets) or dramatically improve its refining results – otherwise, activist pressure will remain high.
HF Sinclair Corporation (NYSE:DINO) – Mid-Continent Refining and Integrated Downstream
Market Position: HF Sinclair (created in 2022 via the merger of HollyFrontier and Sinclair Oil) is a mid-sized refiner with a 6th-largest U.S. capacity of ~678,000 bpd. Its seven refineries are inland – in the Midcontinent, Southwest, Rockies, and Pacific Northwest – giving it a strong presence in those regional markets (PADD II and IV). HF Sinclair also inherited Sinclair’s branded marketing network, including over 300 Sinclair gas stations in 30 states, and a proprietary crude supply in Wyoming/Utah. This vertical integration (refining + retail/marketing) is unique for a refiner of its size, and “provides a counterbalance to volatile refining results” in niche markets. The company also produces specialty lubricants (through its Petro-Canada Lubricants business) and has stakes in midstream logistics (it recently acquired the remaining units of Holly Energy Partners in 2023). HF Sinclair’s asset base skews toward lighter crude processing; it can also run Canadian heavy crude in its Oklahoma and Kansas facilities, though as discussed below, that advantage has narrowed. With the Sinclair merger, DINO gained scale and a famous brand, positioning it as a leading regional refiner with some diversification.
Pricing Model: HF Sinclair’s refining revenues are mostly market-based, but the company benefits from some cost-plus style arrangements within its integrated system. For example, supplying its Sinclair-branded retail stations provides a stable demand with presumably negotiated margins. That said, those stations still must price competitively in their local markets, so HF Sinclair can’t arbitrarily mark up fuel – effectively, it earns the wholesale refining margin plus a retail margin (for any company-owned sites). The majority of HF Sinclair’s output is sold into bulk markets or to third-party distributors at market prices. HF Sinclair historically enjoyed feedstock cost advantages: its Midcon refineries could buy regional crudes (like Wyoming Sweet, Canadian oil sands crude) at a discount. However, these discounts have diminished. The tripling of the Trans Mountain Pipeline (TMX) in 2023 is allowing Canadian crude to reach export markets, reducing the cut-rate pricing HF Sinclair used to get. Likewise, local crudes like Utah’s Uinta waxy crude, once captive to its Salt Lake City refinery, are finding alternate buyers, raising HF Sinclair’s input costs. In short, HF Sinclair’s pricing model is largely commodity-driven, with regional factors influencing its realized margins. When regional fuel supply is tight (e.g. due to fewer local refineries or supply disruptions), HF Sinclair can obtain strong margins. Conversely, when regional crude costs rise (due to new pipelines or potential tariffs on Canadian oil), its cost advantage erodes.
Recent Strategic Actions: The formation of HF Sinclair itself is a recent strategic move – the company was created in March 2022 when HollyFrontier (a Dallas-based refiner) acquired Sinclair Oil’s refining, retail, and logistics assets in a $2.6B deal (paid in stock). This merger added two refineries (in Wyoming and Oklahoma), the Sinclair retail brand, and a renewable diesel plant, significantly expanding the company’s footprint and vertical integration. Post-merger, HF Sinclair has focused on integrating these assets and capturing synergies. It also completed the acquisition of Holly Energy Partners (HEP), its affiliated pipeline company, in late 2022 – bringing logistics in-house and simplifying corporate structure. On the growth side, HF Sinclair has invested in renewable fuels: it converted its Cheyenne, WY refinery entirely to renewable diesel production in 2020, and added renewable diesel units at its Artesia, NM facility (with total renewable capacity ~380 million gal/year). These moves help reduce RIN (renewable credit) exposure and position DINO in the growing biofuel market. HF Sinclair is also expanding its retail presence using the Sinclair brand, aiming to leverage the iconic dinosaur logo to drive fuel sales (it doesn’t report retail segment profits separately, but this presumably boosts overall margin capture).
Recently, however, HF Sinclair has faced headwinds from narrower refining margins. After the 2022 boom (a year in which HF Sinclair enjoyed “large margins” aided by discounted Strategic Petroleum Reserve crude releases), cracks normalized in late 2023/early 2024, compressing earnings. HF Sinclair’s management has responded by exercising capital discipline – the company pays one of the highest dividends in the sector (current yield ~5.4%) and has been opportunistically repurchasing shares. It carries moderate debt (roughly $3.5B, much lower leverage than smaller peers), giving it flexibility to weather downturns. One notable risk HF Sinclair is monitoring is potential U.S. import tariffs on Canadian crude. If such tariffs (floated by a U.S. administration to protect domestic oil) were enacted, it would raise feedstock costs for DINO’s Midcontinent refineries which rely heavily on Canadian imports. So far this is hypothetical, but management has flagged it. In conclusion, HF Sinclair’s strategy is to optimize its integrated model – use captive retail/logistics to maximize margins – while steadily returning cash to shareholders. It isn’t pursuing big acquisitions now (having digested Sinclair) but is improving reliability and cost efficiency to stay competitive as an inland refiner facing new crude dynamics.
PBF Energy (NYSE:PBF) – High-Risk, High-Reward Coastal Refiner
Market Position: PBF Energy is an independent refiner operating six refineries (combined ~1,000,000 bpd capacity) across the West Coast, Midwest, Gulf Coast, and East Coast. It has a coast-to-coast asset base due to aggressive acquisitions over the past decade – PBF bought refineries from majors on the cheap, including facilities in Delaware, New Jersey, Ohio, Louisiana, and California. Notably, in 2020 PBF acquired the 157,000 bpd Martinez, CA refinery from Shell, making it a significant West Coast refiner (though this deal’s timing before the COVID crash saddled PBF with debt and later a costly refinery fire). PBF’s strategy has been to buy underinvested or non-core refineries from larger companies at low prices, then attempt to run them leanly. This has made PBF’s portfolio a bit of a patchwork, but it gives the company exposure to many key markets (Mid-Atlantic, Midcontinent, LA/SF, etc.). PBF does not have retail or significant midstream assets – it’s a pure-play refining company. This provides high leverage to refining margins (when cracks are high, PBF’s earnings skyrocket, but when margins collapse, PBF has no cushion – as seen in 2020 when it came close to breaching liquidity).
Pricing Model: PBF sells its refined products at market spot prices and is perhaps the epitome of a merchant refiner. It lacks proprietary retail outlets or long-term offtake contracts, so essentially every barrel PBF produces is sold into the wholesale rack or export markets for prevailing prices. Its refineries largely rely on third-party logistics and market hubs: e.g. its Midcontinent refinery in Toledo buys Canadian crude via Enbridge pipelines at market-negotiated differentials; its East Coast refinery (Delaware City) buys Brent-linked crudes and sells into the NY Harbor gasoline market, etc. PBF’s realized margins therefore closely track benchmark crack spreads in each region. One element of PBF’s model is feedstock optionality – some of its refineries can process heavy crude or intermediate feedstocks. PBF can purchase discounted feed like high-sulfur resid and upgrade it (particularly at its coking refineries in Delaware and Chalmette). This is a market-driven advantage: e.g. when high-sulfur fuel oil was cheap relative to diesel in 2022, PBF’s coker refineries captured extra margin by turning that resid into distillate. But fundamentally, PBF’s pricing and profitability are dictated by commodity cycles. It has no cost-plus contracts; even a significant portion of its production is sold to other integrated refiners or traders. The company does minimal hedging of crack spreads, so it rides the full wave of market volatility.
Recent Strategic Actions: PBF’s recent years have been eventful and illustrate its boom-bust nature. During the 2020 downturn, PBF was forced to take drastic measures: it shut one refinery (New Jersey’s Paulsboro, partially, and reconfigured operations with its Delaware plant), laid off staff, and took on substantial debt (and even a government pandemic loan) to survive. In 2022’s boom, PBF roared back to profitability – generating record cash flows as crack spreads hit all-time highs. Management used that windfall to repair the balance sheet, paying down ~$2.7 billion of debt and even building a net cash position by early 2023. PBF also initiated its first-ever dividend in 2023 (a modest $0.20/share annualized) after years of not paying one. These moves signaled a shift from pure growth to consolidation and shareholder return.
However, late 2023 into 2024 brought new challenges: refining margins fell to cyclical lows in 4Q24/Q1’25, and a fire at PBF’s newly acquired Martinez refinery (Feb 2023) took a major unit offline. As a result, PBF posted adjusted net losses in multiple recent quarters and free cash flow turned negative. The good news is crack spreads have rebounded in Q2 2025 (up ~30–40% from Q1), and PBF managed to restart Martinez to ~60% capacity by mid-2025. Industry conditions are also set to improve further with upcoming capacity reductions (several competitor refinery closures in late 2025/early 2026 will tighten supply). PBF has stated it will focus on “balance sheet repair” – essentially rebuilding cash – before considering any major growth capex or higher shareholder payouts. It did make one notable investment in late 2022: PBF bought out its partner’s stake in several pipeline and terminal assets (the Torrance Valley Pipeline Company) for ~$200 million, securing logistics around its California refinery. It also had explored a renewable diesel project at Chalmette, but that appears on hold given capital constraints.
CVR Energy, Inc. (NYSE:CVI) – Niche Midcontinent Refiner with Fertilizer Side-Business
Market Position: CVR Energy is a smaller refiner (two facilities totaling ~206,000 bpd) focused on the Midcontinent region. Its Coffeyville, KS and Wynnewood, OK refineries serve the inland Group 3 market (selling gasoline and diesel into Kansas, Oklahoma, etc.). CVR is unique among peers in that it also owns a majority stake (37%) in CVR Partners (UAN), a publicly traded nitrogen fertilizer company. Through this stake, CVR has a secondary business producing ammonia and urea fertilizers, which can provide earnings diversification (the fertilizer segment often performs well when agriculture markets boom, and vice versa). Still, refining typically contributes the majority of CVR Energy’s revenue and EBITDA. CVR’s refining profile is more simplified/local: these are not large coastal refineries but rather small-to-mid size plants optimized for regional crude. Coffeyville can process medium sour crudes (it even has a coking unit) and has historically run a lot of price-advantaged Midcontinent crudes. Wynnewood was a simple plant now partially converted to renewable diesel (it added a unit to make ~100 million gal/year of renewable diesel in 2021, using soybean oil feed). CVR’s market positioning is heavily tied to inland crude dynamics (like the WTI-WTS spreads, Canadian imports) and to regional product supply (Group 3 cracks). The company is majority-owned by activist investor Carl Icahn (~71% stake), who has influenced its strategic direction and capital allocation (often favoring high payouts to shareholders).
Pricing Model: CVR’s refining operations are entirely merchant in nature – buying crude from producers or the Cushing hub and selling fuels at market prices in local markets. There is no retail network; CVR sells bulk gasoline and diesel to distributors and wholesalers. Historically, CVR benefited from a cost-plus dynamic on feedstock: being inland, it could source landlocked crudes (like West Texas Sour, or locally gathered Kansas/Midcontinent crude) at discounts relative to coastal benchmarks. In the early 2010s, CVR’s profitability surged when WTI-priced crude was markedly cheaper than Brent (due to pipeline bottlenecks). However, as pipelines expanded and crude export rules changed, inland crude prices rose to parity with global prices, squeezing CVR’s structural advantage. It now must pay near-market for most crudes (aside from quality differentials). Thus, its refining margin is largely the Group 3 crack spread minus any cost disadvantage from smaller scale. CVR’s product pricing follows the Plains states spot market. One nuance: CVR faces meaningful RIN (Renewable Identification Number) costs because it has limited blending. It has at times sought small refinery exemptions (SREs) to avoid RIN obligations. Under the prior U.S. administration some SREs were granted, saving CVR tens of millions; under the Biden EPA they were denied. CVR (and Icahn) even litigated over RFS policy – Icahn famously argued RIN costs unfairly hurt small refiners. In 2023, a court ordered EPA to reconsider some exemption denials, offering a potential reprieve. If CVR were exempted retroactively, it could reclaim a portion of past RIN expenses – a significant boost to cash (Delek, a peer, noted 2021–2024 compliance costs “way above [its] current market cap”). This is a regulatory wildcard that effectively affects CVR’s net pricing (if SRE granted, net margin improves by the saved RIN cost). For now, CVR’s model is to comply and manage these costs, including by producing some renewable diesel at Wynnewood to generate RINs internally.
Recent Strategic Actions: CVR’s recent focus has been on maintenance and financial reset. In 2023–2024, CVR undertook a major turnaround at its Coffeyville refinery, incurring heavy costs and downtime. This depressed its results in late 2024 and forced the company to suspend its dividend to conserve cash. By mid-2025 the turnaround was completed, and management indicated no major maintenance is due until 2027, setting the stage for several years of strong operations without big interruptions. The company expects improved cash flow in 2H 2025, which it plans to use for debt reduction and then to resume shareholder distributions by early 2026. CVR ended Q1 2025 with a healthier balance sheet and even remarked that at current stock prices it offers a ~14% forward free cash flow yield – pointing to potential value. Strategically, CVR has been relatively conservative on growth: it canceled a planned large renewable diesel project at Coffeyville in 2022 due to cost concerns, deciding not to invest heavily there. Instead, it settled for the small Wynnewood renewables unit (which helps meet just a fraction of its RIN obligation). CVR has also been involved in M&A overtures: Icahn, as majority owner, at one point (2020) pushed for CVR to acquire Delek US (in which Icahn held a stake) – a move aimed at consolidating and creating efficiencies between the two midcontinent refiners. That effort did not succeed, and Icahn later exited his Delek position. But it signals that CVR could be open to an opportunistic merger if it made strategic sense. In the meantime, CVR is something of a “self-help” story: it’s banking on favorable market dynamics (strong summer gasoline demand, low inventories, OPEC keeping crude prices in check) to generate robust earnings, then using those to pay down debt and restart its historically generous variable dividends. It is also closely watching the regulatory front – a positive ruling on RFS exemptions or a drop in RIN prices would directly boost CVR’s refining profitability.
Delek US Holdings (NYSE:DK) – Small Gulf Coast/Permian Refiner with Integrated Assets
Market Position: Delek US is a downstream operator with four refineries (~300,000 bpd total) located in Texas, Arkansas, and Louisiana. These refineries (Tyler & Big Spring, TX; El Dorado, AR; and Krotz Springs, LA) are smaller-scale but strategically situated near the Permian and Gulf Coast regions. Delek also owns a large stake (~63%) in Delek Logistics Partners (DKL), an MLP that handles pipelines, storage, and fuel terminals – many servicing Delek’s refineries. Additionally, Delek has a retail fuel network of 250 convenience stores (mostly in west Texas and New Mexico under the DK and 7-Eleven/Alon brands). This mix of refining, logistics, and retail makes Delek somewhat vertically integrated relative to its size. However, its refining assets are less complex than big peers and have struggled to consistently earn high margins. Delek’s market cap is modest ($2 billion), and it has drawn interest from activists (Icahn in 2020).
Pricing Model: Delek’s refining business, like others, sells into the market at prevailing prices – primarily gasoline and diesel sold wholesale in the Gulf Coast and midcontinent markets. That said, Delek’s retail segment (the convenience stores) purchases fuel from Delek’s refineries (and others) and sells at the pump, so Delek captures some additional retail margin on a portion of its production. Retail sales are a minority of output, but they provide a bit of a cost-plus margin (the stores aim to make a markup over wholesale cost). Delek’s logistics arm (DKL) also generates revenue by charging fees on pipelines and storage – some of those fees are paid by Delek’s refining unit (an intercompany cost), effectively adding to the cost structure of refining but then recaptured as income in the logistics segment. When analyzing Delek, many investors separate these pieces. The refining margin itself is fully market-driven and has been volatile; Delek’s small refineries don’t have significant crude cost advantage and must even purchase RINs for compliance (as Delek’s own blending/renewables production is minimal). In fact, RIN costs have been a major burden – Delek has said it needed ~200 million RINs annually (costing ~$150M at current prices), which sometimes exceeded its refining segment profits in bad years. Delek did obtain small refinery exemptions in the past, but none recently (though a court victory means EPA will reconsider exemptions for 2019–2021 which could refund significant sums).
Recent Strategic Actions: Under CEO Soreq, Delek has actively taken steps to surface the hidden value in its structure. Key moves include:
Reducing its ownership in Delek Logistics (DKL): Through equity offerings and possible asset swaps, Delek has lowered its stake from ~78% to ~63%. This brought in cash and increased the public float of DKL, helping establish a market value for that stake. It also means DKL now carries more third-party business (≈80% of volumes are from third parties, not Delek itself), making DKL’s cash flows more independent. This separation was intended to address the market’s skepticism that Delek’s value was “trapped” in intercompany arrangements.
Asset Swaps and Reorganizations: In 2022, Delek undertook an “asset swap” between Delek and DKL that better aligned assets with their primary operator. For example, DKL might have swapped certain pipeline ownership for Delek’s retail or other assets. The result was a cleaner delineation: Delek (the parent) more purely owns the refining and retail operations, while DKL is more purely a midstream business serving not just Delek but other customers. This was meant to “catalyze the value inherent on paper” of the SOTP thesis. So far, the stock market hasn’t fully closed the valuation gap (DK shares have underperformed simply owning DKL units), but progress has been made in transparency.
Operational improvements: Delek has been cutting costs and improving reliability at its refineries. It had a setback in 2022 when Big Spring refinery experienced an unplanned outage; since then, they have improved uptime. Delek is also exploring renewable fuels on a small scale – it’s been co-processing some bio-feedstocks at Krotz Springs and may consider a larger renewable diesel unit if economics allow.
RIN Relief Efforts: As noted, Delek sued the EPA and won a remand on denied exemptions. Now under a new EPA administrator, there’s hope for some relief. If Delek secures retroactive SREs for 2019–2021, it could claw back up to ~$300M of RIN costs – which would be a massive one-time cash boon (its market cap is only ~$1.4B). Even forward-looking exemptions would save ~$150M/yr. Delek management calls this a potentially “massive” catalyst, though it’s not guaranteed by any means. Investors should watch for EPA’s decision expected in 2025.
Par Pacific Holdings (NYSE:PARR) – Acquirer of Niche Refineries with Upside and Execution Risk
Market Position: Par Pacific is a unique and smaller refiner (approx. 218,000 bpd capacity post-2023 acquisition) that specializes in niche, geographically isolated markets. Par’s assets include the largest refinery in Hawaiʻi (Kapolei, 94k bpd, essentially the only refinery supplying the Hawaiian islands), plus inland refineries in Wyoming (Newcastle, 18k bpd) and Washington state (Tacoma, 42k bpd). In June 2023, Par acquired a 63,000 bpd refinery in Billings, Montana from ExxonMobil, expanding its Rockies presence. These refineries are generally smaller and not coveted by majors due to location or scale, which is exactly why Par was able to buy them relatively cheaply. Par’s strategy has been to “buy distressed refining assets and turn them around” – a contrarian consolidation play in an industry where others have been exiting. In addition to refining, Par Pacific has integrated businesses: it owns logistics pipelines and terminals associated with its refineries, and it runs around 120 retail gas stations (branded “Hele” and “76”) in Hawaiʻi, and recently added stations in Wyoming/Montana. Par also has a 46% stake in an upstream gas producer (Laramie Energy in Colorado), though this is a minor investment. Par’s vertical integration in island and rural markets gives it a quasi-monopoly in some areas (e.g. it supplies jet fuel and gasoline to most of Hawaiʻi’s airports and gas stations). However, this advantage is offset by some structural weaknesses: its refineries are old and high-cost – for instance, Billings is a 70+ year-old plant with operating costs of ~$12.44 per barrel, significantly higher than Par’s other refineries (which are $5–7 per barrel). Also, operating in Hawaii comes with expensive logistics (crude must be shipped in, etc.) and exposure to unique demand patterns (tourism heavily drives fuel demand). These factors have historically kept Par’s profitability low relative to peers (Par’s average EBITDA margin over recent years is under 2%, among the lowest of the group).
Pricing Model: Par’s pricing power varies by region. In Hawaiʻi, Par Pacific is effectively the sole refiner serving the market, which gives it some ability to pass through costs (somewhat a cost-plus model) because alternative supply (imports) would be costly. It sells gasoline, diesel, and jet fuel to local distributors and airlines often at prices influenced by import parity (what it would cost to import fuel to Hawaiʻi). This often allows a premium over mainland prices. In its mainland markets (Pacific Northwest, Rockies), Par is a price-taker in competitive markets. For example, its Tacoma refinery competes with larger Pacific NW refineries, so it sells at Seattle market prices; its Wyoming and Montana refineries sell into regional markets where it has decent share but not monopoly (e.g. Billings refinery competes with Exxon’s Billings refinery and Calumet’s Great Falls plant in supplying the Northern Rockies). Thus, Par’s product pricing is largely market-based, but thanks to its vertically integrated logistics and retail, it tries to capture additional margin. Par’s retail stations in Hawaii essentially buy fuel from Par’s refinery and sell to consumers – capturing the retail markup on top of the refining margin. This integrated model in Hawaii is considered a key part of its strategy. Additionally, Par’s control of logistics (pipelines, storage) in its regions can give it a slight edge in moving products and feedstocks (for instance, with the Billings purchase Par also got interests in a crude pipeline and a products pipeline in the Yellowstone area). Par’s refineries typically run a mix of crudes – Hawaii runs Asian/Australian crudes and some locally produced oil; Wyoming and Montana run local Rockies crudes; Washington runs Alaska North Slope and other crudes delivered via tanker. These crudes are bought at market rates (though some may be niche grades with discount). Par’s overall margin capture depends on it optimizing these supply chains and running at high utilization (which can be challenging given the complexity and age of the plants).
Recent Strategic Actions: Par Pacific has been in growth mode, but that has come with growing pains. Key recent actions include:
Acquisitions: The 2023 Billings, Montana refinery acquisition (for $310M plus ~$299M for inventory) was Par’s largest purchase to date. While cheap on paper (only ~$226M effectively for the refinery assets after backing out pipeline stakes), the refinery is old and inefficient, which has tempered initial returns. Par also bought the Billings refinery’s associated pipelines (65% of Yellowstone Pipeline, etc.), strengthening its logistics position. In 2019, Par acquired the Tacoma, WA refinery for ~$350M, and in 2016 it bought the Wyoming refinery – these prior deals have generally paid off when margins are good, but all acquisitions added debt.
Renewable Fuels Investment: Par is constructing a renewable fuels unit in Hawaiʻi (at Kapolei) to produce ~61 million gallons/year of renewable diesel, SAF (sustainable aviation fuel), and renewable naphtha from local feedstocks. This $90M project (expected on line 2025) could generate lucrative margins (given Hawaii’s high fuel prices and low-carbon fuel incentives) and help offset Par’s sizable RFS compliance costs by generating RIN credits. Management is cautiously optimistic but acknowledges it’s not without execution risk.
Financial Policy – Debt vs Buybacks: Par has a somewhat controversial capital allocation of late. Despite having “junk”-rated debt and substantial leverage, Par’s board approved large share repurchase programs – $67M in 2023 and a new $250M authorization. The company bought back ~1.95M shares at ~$34.85 (vs current ~$25). Analysts like WYCO Researcher have criticized this as “irrational” given Par’s debt and the commodity risk, arguing paying down debt would be wiser (every notch upgrade saves interest expense). Par’s former CEO even sold shares while the company was buying, raising eyebrows. This indicates management has been very bullish on its own value, prioritizing buybacks – a stance not all investors agree with.
Leadership Change: Par’s long-time CEO William Pate retired in May 2024. New CEO (Will Monteleone) has stepped in, and interestingly he did not dismiss the idea of Par being a takeover target when asked – saying management is focused on shareholder value “whether we’re acquiring or we’re the target”. This suggests an openness to sale, which could eventually unlock value if a larger player wanted Par’s unique assets. Par’s large accumulated tax NOLs (~$900M, worth ~$189M) also make it attractive to an acquirer that could use those tax shields.
Operational Performance: 2023 was a mixed year: Par had record earnings in 2022, but by Q1 2024 margins had sharply declined across all refineries (Hawaii gross margin fell to $14/bbl from $19 the year prior, etc.), resulting in a small net loss. This reflects the margin normalization industry-wide. Additionally, Par is undertaking a major turnaround at Billings in Q2 2024 which will further hit near-term results. The company is betting that margins will improve later in 2024/25 (with tourism returning in Hawaii – though Hawaii visitor counts were down ~4% early 2024 – and with overall refining market tightening) to justify its acquisitions. Par also integrated and improved its retail and logistics segment performance (those were bright spots, with logistics income up in Q1 2024 despite refining weakness). Another external factor Par monitors is EV penetration – in its core Hawaii and Washington markets, EV sales are relatively high (11% of new sales in HI, 19% in WA in 2023), which over time could erode gasoline demand. Conversely, in its inland markets (Montana, Wyoming) EV adoption is very low (2–3%), so gas demand there is secure longer. Par is essentially juggling many moving parts: integrating a new refinery, executing a renewables project, managing high debt, and trying to improve margins in challenging markets.
🤼 Competitor Strategy Comparison – Current Tactics and Differences
Despite operating in the same industry, these refiners employ differing strategies and tactics based on their size, asset base, and corporate philosophies:
Scale and Efficiency vs. Niche Focus: The largest players (Marathon, Valero, Phillips 66) emphasize scale and efficiency. Their strategy is to run big, complex refineries at high utilization and low unit cost, yielding superior margins through all cycles. For example, Valero’s strategy is predicated on its industry-leading cost-per-barrel metrics, achieved via efficient operations and high complexity – giving it a structural margin edge that “appears to be well established across all market conditions”. Marathon similarly leverages scale, plus an integrated logistics network (MPLX) to keep costs low and feedstock supply secure. In contrast, smaller companies like Par Pacific and Delek focus on niche markets or specific asset plays. Par targets isolated markets (Hawaii, Rockies) where it can be a dominant supplier and perhaps enjoy local pricing power, accepting that those refineries are higher cost. Delek, meanwhile, has played a value/arbitrage strategy: owning small refineries but extracting value via an integrated model – its strategy literally included a “Sum of the Parts” initiative to highlight the value of its logistics and retail segments supporting the volatile refining segment. Essentially, the big refiners compete on operational excellence and economies of scale, whereas some smaller ones compete by being in the right place at the right time (e.g. Par’s Hawaii near captive market, CVR’s proximity to cheap inland crude historically).
Diversification vs. Pure-Play Refining: Phillips 66 stands out for its diversified approach – it purposely invested heavily outside refining (midstream pipelines, chemical plants) to smooth out earnings and reduce reliance on volatile refining profits. This tactic has delivered strong dividend growth but arguably hindered stock performance (PSX’s refining segment underperformance and heavy petchem capex led to peer-lagging returns, prompting Elliott Management’s intervention). In contrast, PBF Energy is an unabashed pure-play refiner, doubling down on refining exposure (buying more refineries) rather than diversifying – a high-risk, high-reward tactic that gave PBF the biggest upside in the 2022 boom but severe pain in downturns (PBF “bleeding cash” in low-margin periods). HF Sinclair sits somewhat in the middle: it broadened into downstream integration (adding retail via Sinclair and specialty lubes) and renewables, but remains focused on the refining value chain rather than branching into unrelated segments. HF Sinclair’s tactic is to have multiple profit centers within downstream (refining, retail, lubricants, renewable diesel) to buffer any single weakness – for instance, its lubricants business and Sinclair-branded retail provide steady cash when refining margins narrow. Similarly, CVR Energy’s unique strategy is maintaining its fertilizer subsidiary (CVR Partners) – not to expand refining but to diversify into an adjacent commodity. This gives CVR a hedge: when farm economies boom (fertilizer prices up), CVR’s earnings from that segment can offset weak refining margins. However, CVR doesn’t integrate fertilizer with refining operationally; it’s more of a financial diversification.
Capital Allocation – Shareholder Returns vs. Growth Capex: A clear strategic divergence is how refiners allocate capital. Marathon and Valero have prioritized shareholder returns and balance sheet strength in recent years. Marathon, flush with Speedway sale cash, aggressively bought back stock (retiring ~30% of shares) and continues large dividends – essentially returning “ex-ordinary” amounts of cash rather than building new refineries. Valero likewise has channeled excess cash to buybacks/dividends (10% cash yield in 2024), while keeping growth capex moderate and focused on high-return projects (like incremental expansions or renewables). Phillips 66 also has been very shareholder-friendly in terms of dividends, but it did invest heavily in acquisitions (DCP Midstream, etc.), so it balanced growth and returns – a strategy now questioned by activists who feel PSX over-invested in lower-return projects instead of maximizing buybacks. On the other hand, Par Pacific has been very growth-focused, plowing cash (and taking on debt) to acquire refineries, even at the cost of higher leverage and zero dividends. Par’s management clearly believed reinvesting in asset growth would yield higher long-term value than near-term shareholder payouts. This is controversial – as noted, some analysts call Par’s recent $250M buyback plan “irrational” given its debt load. That said, Par’s tactic of opportunistic M&A (buying at low multiples) could pay off handsomely if margins normalize in its regions – effectively a reinvestment strategy over distributions. PBF Energy similarly prioritized survival and deleveraging over immediate returns: after its 2020 scare, PBF used 2022–23 cash to reduce debt dramatically rather than initiate big dividends (only in 2023 did it start a token dividend). PBF’s strategy is to keep optionality for future cycles rather than lock into high payouts now. Delek has been in between – it maintains a modest dividend but also has been investing in unlocking value (which may eventually lead to stock appreciation rather than needing to pay huge dividends). Delek’s intriguing tactical focus is on regulatory catalysts: it’s lobbying for RIN exemptions retroactively, a strategy that, if successful, is essentially “creating value via policy” rather than via operations. This is a unique approach among peers (most others just treat RINs as a cost of doing business, whereas Delek is actively pursuing litigation and regulatory relief as a value driver).
Operational Tactics – Cost Management and Uptime: All refiners talk about cost discipline, but some truly differentiate in execution. Valero is known for running a tight ship – it consistently reports lower operating costs per barrel than peers and executes maintenance efficiently. In Q2 2025, despite heavy turnaround activity, Valero projected maintaining its cost leadership. This is a tactic of investing in reliability and workforce to minimize unplanned outages. Phillips 66 has also improved operations, claiming second consecutive year of >98% utilization (above industry average), which is notable for maximizing throughput – though critics note high utilization hasn’t fully translated to superior profits for PSX’s refining (implying room to improve cost or yields). Smaller refiners can’t achieve the same economies of scale, but they employ other tactics: HF Sinclair and CVR both converted units to produce renewable diesel, not only to gain new product revenue but to reduce compliance costs (this is an operational tweak to turn a liability – RFS obligation – into a profitable activity by producing the renewable fuel in-house). Delek and PBF have likewise dabbled in co-processing renewables for RINs. Another operational tactic is product mix optimization. Many refiners aim to maximize diesel yield especially when diesel cracks are strong (diesel often has structurally higher margins than gasoline). For example, Phillips 66 touted a record 88% clean product yield, meaning it is producing more high-value fuels and less low-value residue – a result of investing in upgrades and running lighter crudes. This is a tactic to squeeze more margin from each barrel. Market exposure management is another subtle tactic: some refiners hedge crude or cracks to smooth results, others go unhedged. Most of these independents do little hedging (preferring exposure to upside). PBF historically did minimal hedging, amplifying swings. In contrast, a company like Valero occasionally hedges input costs (like natural gas) to control a major cost. The strategic choice here is between stability vs. full exposure.
Responding to Energy Transition: Strategies also differ in addressing long-term threats like decarbonization. Marathon and Phillips 66 have taken significant steps to invest in renewable fuels (Marathon’s Martinez JV, Phillips’ Rodeo conversion), aiming to repurpose existing assets for a lower-carbon future. Valero doubled down on renewable diesel through its JV as well. These tactics hedge against declining fossil fuel demand by tapping into subsidies and growth in biofuels. HF Sinclair similarly is producing renewable diesel at two sites. Meanwhile, PBF and CVR have been more cautious/hostile – PBF cancelled a big renewable project due to cost, preferring to focus on core refining for now; CVR shelved its plan citing economics. Their tactic is essentially to delay energy transition investments and potentially let others bear that cost. This could yield higher short-term returns but might leave them more exposed later if fuel demand declines or if carbon regulations tighten. Delek has not announced major energy transition projects either – it seems to be betting on refining’s viability over its 3–5 year horizon, aside from minor co-processing to reduce RIN costs.
📈 Historical and Forecast Growth Performance

The past five years have been extremely volatile for refiners, producing a wide divergence in growth trajectories. On a revenue basis, most refiners saw sharp swings rather than steady CAGR growth, due to the oil price crash/rebound. When COVID-19 hit in 2020, product demand collapsed and all independents watched sales crater 30 – 50 %. Then the post-lockdown recovery—and 2022’s record crack spreads—sent invoices soaring, in many cases doubling year-on-year. This push-and-pull produced eye-catching compound-annual-growth-rates (CAGRs) that often say more about deal-making and price cycles than organic expansion.
HF Sinclair (DINO) tops the leaderboard, posting roughly +10 % five-year revenue CAGR. Most of that lift came from its 2022 merger with Sinclair Oil, which bolted on two refineries and a retail network. Organic sales at the pre-merger HollyFrontier business were flat-to-down before the deal; the headline growth is therefore bought, not built.
Par Pacific (PARR) nearly doubled reported revenue by gobbling up refineries in Tacoma (2019) and Billings (2023). Capacity jumped from ~110 kbpd to ~218 kbpd and five-year sales CAGR clocks in around 7 %. Yet margins remain razor thin, leaving the bigger revenue base to do little heavy lifting for shareholders.
Marathon Petroleum (MPC) and Phillips 66 (PSX) each delivered a solid ~5½ % CAGR without major refinery purchases after 2018. Scale, export optionality, and 2022’s pricing windfall were enough. MPC’s 2018 Andeavor deal inflated 2019 turnover, and PSX’s diversified downstream slate helped offset its sluggish refining unit. Both saw 2020 revenue plunge but staged full recoveries by 2022.
Valero (VLO), the cost-leader, shows a more modest ~4 % CAGR—but remember: its strategy is to squeeze margin, not chase volume. Even with slower top-line growth, Valero produced industry-leading cash returns because every sales dollar carried more profit.
PBF Energy (PBF) registers roughly 5 % five-year revenue CAGR, yet the series is chaotic: a Martinez acquisition in 2020 swelled capacity, but demand shock that same year cut revenue in half; a 2022 spike then tripled it. Add a refinery fire in 2024 and the line looks like an EKG—“growth” exists only if you average the swings.
Delek US (DK) and CVR Energy (CVI) tell a cautionary tale. Nominal five-year CAGRs sit near 5 % and 4 % respectively, but both suffered deep 2020 troughs, uneven utilisation, and hefty RFS costs. YoY revenue in 2024 fell double-digits (-28 % DK, -16 % CVI) as turnarounds bit and prices cooled—evidence that the long-term average hides prolonged stretches of stagnation.
Consensus says the refinery industry will see flat-to-slightly-negative sales through 2030 once inflation is stripped out. But just like the last five years, the real action will be in the outliers.
📊 Industry Trends and Growth Drivers
Several key trends are shaping the U.S. refining industry’s present and near-future outlook:
Capacity Rationalization and Consolidation: A notable trend is the closure or conversion of refineries, which has tightened supply. Since 2020, the U.S. has lost over 1 million bpd of refining capacity due to permanent shutdowns or conversions to biofuel plants (e.g. Marathon’s Martinez conversion, Phillips’ Rodeo conversion, Shell’s Convent closure, etc.). In 2023 alone, three U.S. refineries closed and Phillips 66 plans to close its Los Angeles area refinery by Oct 2025. Valero also signaled it will likely shut its small Benicia, CA refinery by 2026. Each closure removes product supply, which, all else equal, is bullish for surviving refiners’ margins. As one report noted, with these reductions “the market is positioned to see margins expand as it transitions to slightly under-supplied” by 2025–26. This trend, driven by environmental pressure and poor economics at older plants, effectively pools more market share into the remaining refineries. Companies like Valero and Marathon benefit disproportionately, as they can increase utilization and sales into the gap. Consolidation is also occurring via M&A – larger players have been hesitant yet (no major refiner M&A in the U.S. in recent years), but smaller deals like HF Sinclair buying Sinclair or Par Pacific picking up orphaned assets continue. With few willing buyers for aging refineries, the industry may see more closures rather than acquisitions going forward, particularly in regions like the U.S. East Coast and West Coast where environmental regulations and community opposition make operations tough. This rationalization supports a healthier supply-demand balance, reducing the chronic overcapacity that plagued refiners pre-2020. It’s a key driver behind forecasts for strong refining margins mid-decade.
Robust Diesel Demand and Distillate Strength: Globally and in the U.S., diesel (distillate) demand has been relatively strong and is projected to remain robust in the near term. Factors include economic expansion (diesel is tied to freight/trucking activity), and a post-pandemic rebound in air travel (jet fuel is a distillate). Additionally, Europe’s disconnection from Russian diesel imports (due to sanctions) has opened opportunities for U.S. Gulf Coast refiners to export diesel overseas at high margins. U.S. distillate inventories have been running well below historical norms – by mid-2025 distillate stocks were very low, in contrast to gasoline which had normalized. This tightness supports elevated diesel crack spreads. Many refiners have maximized diesel yield as a result. Diesel is also less threatened by EVs in the immediate term (EV adoption is mostly impacting gasoline passenger cars first, while heavy-duty trucks and aviation will rely on diesel/jet for longer). So diesel-oriented refiners or those with high middle-distillate yield (e.g. Valero, Marathon) have a favorable trend. One caveat: a mild recession could soften diesel demand via reduced trucking, but infrastructure spending and a shift from natural gas to diesel in some power generation (in Europe, for example) have provided a floor. In sum, distillate demand and pricing are a positive driver, and many U.S. refiners are capitalizing on it, exporting surplus diesel.
Octane and Gasoline Dynamics: On the gasoline side, demand in the U.S. has plateaued below pre-COVID highs (~5–10% below 2019 levels) and long-term trend is flat to slightly declining as vehicle fuel efficiency improves and EVs make small inroads. However, near-term gasoline demand has been resilient – 2023 and 2024 saw strong summer driving seasons. Low inventories in spring 2025 helped gasoline cracks rebound. A specific trend within gasoline is high demand for octane (premium gasoline, and blending components like alkylate), driven by both consumer preference for premium and refiners needing to offset ethanol’s lower blending octane. Refiners that invested in octane units (alkylation, reformers) can benefit from this. Nonetheless, gasoline is considered the segment most vulnerable to EV adoption. Policy moves like states mandating zero-emission vehicle sales by 2035 (e.g. California) signal eventual decline in gasoline demand growth. Over a 3–5 year horizon, this effect is minimal (EVs are still <1% of U.S. fleet), but investors are mindful of it in valuations. This specter of peak gasoline demand is partly why refiners are cautious about major expansion projects. Instead, they favor debottlenecking and flexing yields (making more diesel/jet, less excess gasoline).
Environmental Regulations and Climate Policy: Refiners face a range of environmental regulations that impact costs and operations. Key among these is the Renewable Fuel Standard (RFS), which requires blending biofuels (ethanol, biodiesel) – if refiners don’t blend enough, they must buy RIN credits. As discussed, RIN costs have become a huge expense (hundreds of millions annually for some). The industry trend has been either lobbying for relief or investing in renewable fuel production to generate credits. Many refiners (Valero, HF Sinclair, Marathon, Phillips) have built or are building renewable diesel plants, partly to reduce net RIN exposure and capitalize on state/federal incentives. For example, Marathon’s Martinez renewables JV will produce RD and generate credits both under RFS and California’s LCFS (low carbon fuel standard). HF Sinclair and CVR converted units for the same reason. This trend effectively is integrating biofuels into traditional refining. Another regulatory trend is tightening emissions and fuel specs: Tier 3 gasoline (10 ppm sulfur) came into full force in 2020, which required some investment but is now done. Future potential rules could target refinery CO₂ emissions – a few states are considering carbon caps or additional cap-and-trade costs for refineries. And as mentioned, a prospective tariff on imported crude (like Canadian oil) has been floated politically; if enacted, it would raise feedstock costs for inland refiners and benefit those running domestic light oil, but this is speculative and would face pushback.
Global Capacity Additions vs. U.S. Exports: On the global stage, massive new refineries in China, the Middle East (e.g. Saudi Arabia’s Jazan, Kuwait’s Al-Zour, Nigeria’s Dangote, etc.) are coming online 2022–2025, which contribute to a potential oversupply of refined products globally. Indeed, these additions contributed to weaker refining margins in 2023 as global markets were oversupplied. However, capacity closures in the U.S. and Europe provide some offset. The U.S. remains a key exporter of refined products – exporting ~3-4 million bpd (diesel, gasoline, etc.). Exports have become a structural outlet for U.S. Gulf Coast refiners, especially with domestic gasoline demand stagnant. A risk is if global markets become too oversupplied (from new Asian/Mideast refineries), export margins could shrink. So far, a combination of global demand growth (post-COVID recovery, and countries returning from lockdowns) and disruptions (Russia sanctions) have allowed U.S. exports to stay competitive. The trend of U.S. as the world’s top refined product exporter is likely to continue, but refiners will keep an eye on global capacity. Notably, by 2025–2026 the excess capacity build cycle is expected to slow, and with older refineries closing, the global market might tighten again – supporting U.S. export economics. This dynamic is a driver behind the bullish outlook of some analysts for 2025 margins.
Refinery Utilization and Operating Rates: Another trend is refiners running hard to capture margins when they’re available. After the 2020 nadir (utilization fell to ~70%), U.S. refinery utilization rebounded to ~94% in summer 2022. It came off slightly in early 2023 with maintenance (Valero and others deliberately did heavy turnarounds), but by summer 2025 it’s climbing again. The industry’s ability to run near full tilt without breaking is crucial – and it’s getting tested as plants age and workforces thin. We saw a series of unplanned outages (fires, malfunctions) in 2022–2023 that temporarily spiked regional fuel prices. For instance, a fire at Marathon’s Garyville refinery in 2023, or PBF’s Martinez fire, showed the fragility of the system at high throughput. The trend going forward is possibly more preventive maintenance (to avoid costly downtime) even if it means running a tad lower utilization. Valero, for example, planned to run only ~89% in Q2 2025 due to maintenance. Still, with slim spare capacity worldwide, any unplanned downtime can create mini-booms for competitors. Refiners thus benefit from each other’s unexpected issues (as seen in Q2 2025 when “several unexpected domestic refinery outages” helped elevate margins). This environment encourages the well-prepared operators and penalizes the under-maintained – a trend where reliable players like Valero hope to gain market share when peers stumble.
Environmental, Social, Governance (ESG) Pressure: Refiners are under pressure from investors and regulators to reduce carbon footprints. This has led to trends like refinery renewable conversions (as discussed) and increased disclosure of emissions. Some refiners (Phillips, Marathon) have set carbon intensity reduction targets or net-zero goals (mostly for 2050). In the medium term, this is driving some capital spending toward energy efficiency (e.g. cogeneration plants, hydrogen integration) and away from large new crude capacity. ESG pressure also affects financing – it’s getting tougher to raise capital for refinery expansions, effectively capping growth and pushing management to return capital to shareholders instead.
Fuel Quality Transitions: One recent past trend that still has impact is the IMO 2020 regulation (which in 2020 lowered the sulfur limit for marine bunker fuel). This sharply increased demand for very-low-sulfur fuel oil and marine gasoil (diesel-like fuel) and decreased demand for high-sulfur residual fuel. Complex refiners with cokers/hydrocrackers (Valero, Marathon, PBF) benefited by upgrading resid into compliant fuels, whereas simple refiners without those units were hurt as high-sulfur fuel oil became almost unsellable or had to be heavily discounted. The initial IMO 2020 effect was masked by the pandemic (which reduced shipping fuel demand), but as shipping rebounded, those with upgrading capability have enjoyed a wider heavy crude differential and strong distillate cracks. This trend favors complex refiners vs. simple ones, and continues to some extent (though much of the market has adjusted).
🎯 Key Success Factors and Profitability Drivers
Success in the traditional refining sector hinges on several critical factors and drivers of profitability:
Refinery Complexity & Crude Flexibility: One of the most important drivers is having complex refining configurations (e.g. catalytic crackers, hydrocrackers, cokers) that allow processing of cheaper, lower-quality crudes into high-value fuels. High complexity (measured by Nelson Complexity Index) is a success factor because it lets a refiner buy discounted heavy/sour crude and still meet product specs, thus capturing a wider margin. For instance, Valero’s and Marathon’s large coastal refineries are highly complex and have never had to shut down even in weak markets due to their ability to run inexpensive feedstocks. Complexity also enables production of a greater proportion of light fuels (gasoline, diesel) versus residuals, which improves margin capture (PSX noted a record 88% clean product yield – indicating high upgrading capability). In addition, feedstock flexibility – the ability to switch between crudes – is key. Successful refiners secure access to multiple crude sources and can pivot if one type becomes expensive. For example, a Gulf Coast refiner that can run either light shale oil or heavy Canadian/Mayan crude can choose the optimal slate depending on price spreads. This flexibility was a big factor in U.S. refiners’ competitiveness post-2008 when domestic crude was cheapen.
Operational Efficiency & Low Cost per Barrel: The best refiners operate with strict cost control and high reliability. A low operating expense (OpEx) per barrel gives a permanent advantage – it means a refinery can remain profitable at lower crack spreads than a high-cost competitor. Valero’s success is largely attributed to its industry-low operating cost per barrel. It invests in energy efficiency, uses cheap refinery fuel gas (and even co-located hydrogen plants) to keep costs down, and runs its assets at high utilization (spreading fixed costs). Efficiency also includes labor productivity and economies of scale – larger refineries tend to have lower per-barrel labor and overhead costs. Maintenance excellence is another aspect: minimizing downtime and preventing accidents ensures steady throughput and avoids huge unplanned expenses. A culture of safety and preventative maintenance, which Valero and others emphasize, directly correlates to profitability (since an outage not only incurs repair costs but also lost margin opportunity). On the flip side, companies that suffered frequent outages or high costs (e.g. some smaller independents) have struggled to stay competitive. In short, being the low-cost producer in any given market is a key driver of who makes money when margins tighten. This also encompasses compliance cost management – efficient refiners minimize waste, emissions, and thus regulatory costs per barrel.
Location & Logistics Advantages: Refining is also about location, location, location. Being near key markets or crude sources can grant either cost advantages or pricing power. For instance, refiners located on the Gulf Coast have superb export access and pipeline connections, allowing them to source cheap crude (Permian, Canadian via Cushing) and reach demand centers (Latin America, Europe) easily. This logistical advantage translates to higher netbacks. Similarly, a refiner like Par Pacific in Hawaiʻi benefits from being the only game in town – its location in an isolated market means it can often charge a premium (since alternative supply must be shipped from afar). Another example: midcontinent refiners (like HF Sinclair, CVR) historically enjoyed access to landlocked crude at a discount and sold into markets with few competitors – when that dynamic holds, it’s very profitable. Location factors also include access to infrastructure: owning or controlling pipelines, storage, and docks ensures a steady flow of crude in and products out, even in disruptions. Marathon’s extensive pipeline network via MPLX is a competitive advantage – it can deliver crude and evacuate products more cheaply than a refiner that has to rely on third-party transport. In sum, supply chain integration – from crude source to fuel customer – is a success factor. Companies like Marathon, Valero, and HF Sinclair that have integrated logistics or retail can secure margins at multiple points (refining margin plus pipeline tariff or retail margin). This not only enhances profit but also insulates from external logistic bottlenecks or price squeezes.
Market Position & Scale: Being a market leader or having significant scale in a region can improve bargaining power and stability. Large refiners can negotiate better crude procurement terms (volume discounts, priority on pipelines) and better sales terms (they can supply large customers like airlines or retail chains under contracts). Scale also helps in spreading overhead like R&D, trading operations, and corporate costs. For example, Valero’s commercial trading arm is very adept at crude sourcing and product placement globally; smaller firms may not even have in-house trading, relying instead on spot transactions. Scale further aids in portfolio optimization – big refiners with multiple plants can shift production among facilities to optimize economics (if one region’s margins are higher, they can adjust yields or direct more supply there). A concrete instance: during hurricane season or regional outages, large companies can re-route products from other refineries to capitalize on local price spikes (or to meet contractual obligations, avoiding penalties). A diverse portfolio also mitigates localized issues. Marathon and Valero’s geographic spread meant that even when California margins tanked or a Gulf Coast hurricane hit, their other refineries elsewhere could pick up slack, keeping overall earnings more stable. Thus, while not every successful refiner is huge, there is a reason the top independent refiners consistently outperform – they have the scale and market clout to optimize and negotiate in ways smaller players can’t.
Financial Discipline & Strong Balance Sheet: Refining is cyclical, so companies that manage leverage and cash prudently are more likely to succeed long-term. A strong balance sheet (low debt, high liquidity) is a success factor because it enables a refiner to withstand downturns (avoiding distress or equity dilution) and to invest counter-cyclically (e.g. buying assets cheaply in a downturn or investing in upgrades when others can’t). Marathon and Valero exemplify this – both entered the 2020 crash with relatively healthy balance sheets and were able to avoid cutting dividends or diluting shareholders, and then aggressively capitalize on the 2022 upturn to further strengthen finances. In contrast, weaker players like PBF had to issue equity at low prices and take expensive loans in 2020, which hurt existing shareholders. Financial strength also ties to capital allocation: successful refiners invest in high-return projects (not growth for growth’s sake) and return excess cash to shareholders (imposing discipline on management). This is why investors favor companies like Valero that steadily increased dividends and only undertake growth capex if it clearly boosts margins. Moreover, risk management (hedging key exposures when appropriate, insuring assets adequately, etc.) is part of financial discipline that can preserve cash in volatile times.
Adaptability and Strategic Foresight: The refining business environment is changing with regulations and technology. The companies that succeed are those that anticipate and adapt. Regulatory adaptability is huge – for instance, compliance with the IMO 2020 marine fuel change: refiners who invested in desulfurization units beforehand reaped rewards, those who didn’t were caught flat-footed. Similarly, adapting to the RFS by investing in renewables or blending infrastructure has been a smart move for many (Valero’s early investment in ethanol and renewable diesel now pays off in RIN credits and profits). Environmental compliance in general – whether it’s installing emissions controls to avoid fines or proactively reducing carbon intensity – avoids costly disruptions and enhances a refiner’s license to operate. On the market side, adaptability means being able to shift yield slate (more jet fuel when aviation rebounds, more gasoline in summer driving season, etc.), as well as being responsive to new demand patterns (like producing more alkylate for high-octane gasoline if that is in deficit). Customer relationships can also be a driver: refiners that secure long-term supply contracts with large buyers (airlines, trucking fleets, government, etc.) ensure stable outlets for their product through cycles, which is a competitive advantage.
Technology and Skilled Workforce: Operating refineries optimally requires advanced process control, automation, and a skilled workforce of engineers and operators. Those refiners that invest in modern control systems, real-time optimization software, and continuous training of personnel can run more efficiently and safely. For example, some leading refiners employ proprietary modeling systems to optimize crude blending and unit severities daily to eke out extra dollars per barrel. A knowledgeable trading desk to source crudes and place products globally is another intangible success factor. Essentially, institutional knowledge and technical know-how accumulated over decades (Valero is often cited for its strong technical teams and knowledge sharing across its system) can set apart top-tier operators from average ones.
💼 Porter’s Five Forces Analysis
To evaluate the competitive dynamics of the U.S. refining industry, we analyze it using Porter’s Five Forces framework:
Threat of New Entrants: Very Low. Barriers to entry in refining are extremely high. Building a new refinery requires enormous capital (several billions of dollars), technical expertise, and faces stringent environmental permitting and regulations. No large greenfield refinery has been built in the U.S. in nearly 50 years (the last major one was in 1976). Would-be entrants are deterred by lengthy approval processes (often a decade or more), community opposition (“Not In My Backyard” resistance to new industrial plants), and environmental constraints. Additionally, the market is mature with well-established incumbents who have economies of scale – a new entrant would not easily achieve competitive cost per barrel. The only “entrants” in recent memory have been either through acquisition of existing sites (e.g. new companies buying old refineries, like Par Pacific did) or capacity expansion by incumbents. The latter is also limited by regulatory hurdles. Furthermore, projections of flat/declining gasoline demand due to EVs reduce the incentive for anyone to invest in new refining capacity.
Threat of Substitutes: Moderate and Increasing. Traditionally, refined fuels have few direct substitutes for transportation – gasoline and diesel were essentially irreplaceable for cars and trucks, and jet fuel for planes. However, this is changing gradually. The rise of electric vehicles (EVs) poses a long-term substitute threat to gasoline (and potentially diesel for light-duty). EV sales are accelerating (e.g. ~6% of new U.S. cars in 2022 were electric, with higher percentages in states like California and Washington), and government policies (like zero-emission vehicle mandates by 2035 in some states) will further boost this trend. Over a 5-year horizon, EVs may start denting gasoline demand growth and could lead to an absolute decline in demand in certain regions. Likewise, biofuels (ethanol, biodiesel, renewable diesel, SAF) are substitutes mandated into fuels – though refiners often produce or blend these themselves, they effectively reduce the petroleum volume needed. Natural gas as a substitute for diesel in some trucking or for bunker fuel in ships (LNG-powered vessels) is emerging, albeit slowly. Hydrogen fuel cells are another potential substitute in heavy transport, but not significant yet. For aviation, there is not a viable substitute for jet fuel at scale in the near term (aside from blending some SAF). Overall, while substitutes are not collapsing demand in the immediate term, the trajectory is for increasing substitution (especially EVs reducing gasoline demand beyond 2025). The fact that major oil companies and refiners are investing in EV charging, biofuels, and hydrogen shows they acknowledge this threat. In Porter’s terms, the threat is moderate now (limited impact on refiner profits today) but clearly rising towards the end of the decade.
Bargaining Power of Suppliers (Crude Oil Suppliers): Low to Moderate. The primary suppliers to refiners are crude oil producers. Individual crude suppliers have limited bargaining power because crude is a global commodity – refiners can generally source from a worldwide pool of suppliers (domestic producers, OPEC, etc.). No single producer (except perhaps a large state entity like Saudi Aramco) can dictate terms to a refiner; prices are set by global benchmarks (WTI, Brent). In the U.S., the shale revolution actually tilted power towards refiners for a while: a surge in crude supply kept WTI prices relatively low, giving refiners a cost advantage. That said, OPEC+ as a cartel influences global crude prices through output decisions, which affects refiners’ cost of feedstock. When OPEC restrains output (as in 2023–2024), crude prices rise, potentially squeezing refiners if product prices don’t keep up – in that sense, upstream collusion can hurt refiners’ margins. But refiners mitigate this via purchasing flexibility and crude inventories. Also, certain refiners have captive or integrated supply (Marathon’s long-term contracts, HF Sinclair’s self-owned Sinclair Oil production, Par’s stake in Laramie Energy) which slightly buffers supplier power. Another supplier group is equipment and catalyst providers for refineries; while important, there are multiple competing vendors for catalysts, etc., and these costs are a smaller portion of overall expenses. On balance, crude suppliers as a whole do not hold excessive bargaining power over U.S. refiners because refiners can switch sources (e.g. import if domestic is pricey, and vice versa). However, there are moments of localized power – e.g. Canadian heavy crude suppliers gained some pricing power when new egress (TMX pipeline) gave them alternative markets, forcing inland refiners to pay more. Similarly, if certain specialized crudes (like very light shale condensate or unique grades for niche refiners) are in short supply, those suppliers have leverage.
Bargaining Power of Buyers (Fuel Customers): Low (at consumer level) to Moderate (at wholesale level). The ultimate consumers of refined products (drivers, airlines, trucking firms, etc.) are numerous and fragmented, and fuel is a necessity for them with few immediate alternatives. Therefore, individual consumers have virtually no pricing power – they must pay the market price at the pump or for jet fuel. However, there are some nuances: price sensitivity among consumers is high – if prices go too high, demand can fall or political pressure mounts (e.g. calls for gas tax holidays, etc.), indirectly constraining refiners. But in terms of direct bargaining, end-consumers can’t negotiate prices down. On the wholesale side, large buyers like airlines or retail chains (e.g. big-box stores that buy fuel to resell) may negotiate supply contracts with refiners. These big buyers can pit suppliers against each other to secure slight discounts or favorable terms, especially if there’s excess supply. For instance, an airline might tender for jet fuel supply at an airport; multiple refiners compete, giving the airline some leverage on pricing (usually pricing is indexed minus a differential). Similarly, branded jobbers (fuel distributors) might negotiate discounts or incentives from refiners in exchange for volume commitments. So, in wholesale markets where a few large customers exist (commercial fuel, petrochemical feedstock buyers), buyer power is moderate. Another factor is switching ability: fuel buyers can switch brands easily since gasoline is largely a fungible good – hence refiners cannot differentiate product to lock in customers (except via loyalty programs or branding, which confers only a minor edge). Also, in some regions, refined product imports can serve as an alternative supply if local refiners overprice – for example, East Coast gasoline buyers can import from Europe, imposing a cap on how high local refiners can charge. Overall though, refiners typically price at market and buyers have to accept it or reduce consumption.
Intensity of Rivalry Among Existing Competitors: High. Refining is a commodity industry, and competition is largely based on price (margin). U.S. refiners engage in intense rivalry, especially in oversupplied conditions. They cannot easily differentiate their gasoline or diesel – one refiner’s product meets the same specs as another’s – so they compete on who can produce and deliver at lower cost. When capacity exceeds demand, refiners undercut each other’s prices until margins shrink to minimal levels. The industry is cyclical: during weak demand or high crude cost periods, we’ve seen price wars or at least very low margins as refineries try to avoid shutting down by pricing fuels cheaply. The exit of weaker players (closures) has reduced the number of competitors, which can ease rivalry slightly by concentrating market share. But even the big remaining players will fight for every barrel of market. For example, Gulf Coast refiners compete vigorously to supply Latin America; Midwest refiners compete on supplying the Plains states, etc. Because fixed costs are high, refiners have an incentive to keep running and selling fuel even at slim margins – this exacerbates rivalry since no one wants to be the first to cut runs and give up market share. Additionally, many refiners are now flush with cash (after 2022) and investing in efficiency, which means they won’t back down easily in a margin fight. One moderating factor is regional oligopolies: in some areas, only a few refineries supply the market (e.g. West Coast, Rocky Mountains). In California, five companies supply nearly all the fuel, which can result in more rational pricing at times (though they are still constrained by import parity – if they all price too high, imports flow in). There have been accusations occasionally of tacit collusion in such markets, but generally the refiners deny this and attribute price spikes to supply disruptions.
💵 Financial Metrics Analysis (Profitability & Efficiency)
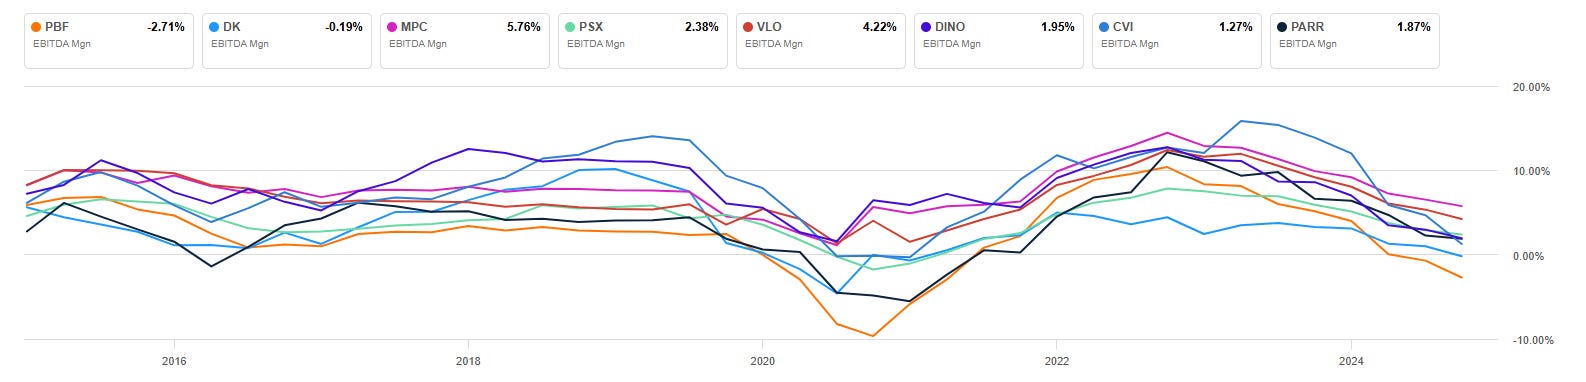
Marathon Petroleum (MPC) and Valero Energy (VLO) clearly lead the industry in profitability, with average EBITDA margins of approximately 5.8% and 4.2% respectively. These margins are substantially higher than those of their peers, reflecting Marathon’s and Valero’s superior cost efficiency, scale, and refinery optimization. Notably, Valero has never had a negative EBITDA year – even in 2020’s collapse, it stayed positive – underscoring its ability to manage through downturns with relatively healthy margins. Marathon’s high margin partly benefits from its integrated midstream/retail structure (which captures additional value) and the synergies from its Andeavor acquisition.
In contrast, Phillips 66 (PSX) shows a mid-pack EBITDA margin around 2.4%, significantly lagging the leaders. This aligns with critiques of PSX’s refining segment being a chronic under-performer – its large diversified operations have not translated into refining margin excellence. The smaller independent refiners fared even worse on average: HF Sinclair (DINO) around 2.0%, CVR Energy (CVI) ~1.3%, and Par Pacific (PARR) ~1.9%. Delek US (DK) was roughly breakeven at –0.2% average EBITDA margin, and PBF Energy (PBF) actually had a negative average EBITDA margin of about –2.7% over the period. These low or negative averages indicate that these smaller players experienced multiple weak years (e.g. 2020 losses were so deep that they dragged multi-year averages below zero for PBF and Delek). It highlights structural issues: higher costs and less resilience to downturns. For instance, PBF’s margin profile was severely hit by 2020’s losses and its West Coast challenges, while Delek and Par each had periods of very slim margins due to their scale and RIN expenses.
The chart’s trend lines (2016–2023) also illustrate volatility: we see all refiners’ margins dip sharply into 2020, then spike in 2022, and normalize by 2023. But crucially, the amplitude differs – Valero and Marathon not only peaked higher in boom times, but fell less in bad times (never dropping as low as the others). In 2020, several competitors approached zero EBITDA or worse, whereas Valero still “generated almost as much EBITDA as the weakest refiners made in 2023” during that downturn. This speaks to the leaders’ consistency.
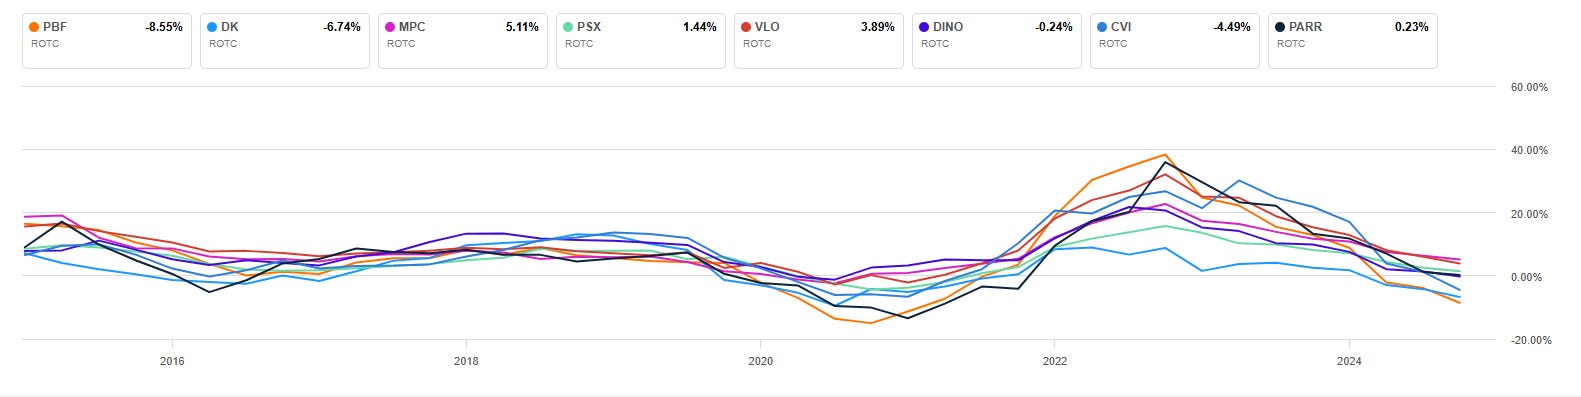
These margin disparities translate to differences in Return on Total Capital (ROTC). Valero and Marathon post the strongest ROTC – indeed Valero’s superior margins and moderate debt have yielded excellent returns. Marathon’s ROTC is boosted by the massive cash generation and asset-light approach post-Speedway sale (lots of cash returned, shrinking equity). Phillips 66’s ROTC has been mediocre – large capital employed in midstream/chemicals with underwhelming returns dragged its overall ROCE down into single digits at times. That underperformance is a key reason Elliott is agitating for better capital allocation.
For the smaller players: HF Sinclair has had a decent ROIC in good years (when margin in Midcon was high) but weaker in others – likely mid-single-digit and even negative percentage returns on capital over the cycle. Delek, Par, CVR, PBF have often struggled to earn their cost of capital. Negative EBITDA years mean negative returns; even in good years their ROIC might briefly spike (e.g. PBF in 2022 had huge ROCE, but over the 5-yr period, average ROCE is very low or negative). One can say these smaller refiners destroyed capital during the down-cycle and only partially made it up in the up-cycle.
The Return on Total Capital essentially mirrors the story told by EBITDA margins: Marathon and Valero are the only ones clearly generating strong returns on capital across cycles, thanks to structural advantages. Phillips 66 has underachieved relative to its asset base (hence a depressed valuation). The others have had episodic returns (high in 2022, but near zero or negative over a full cycle).
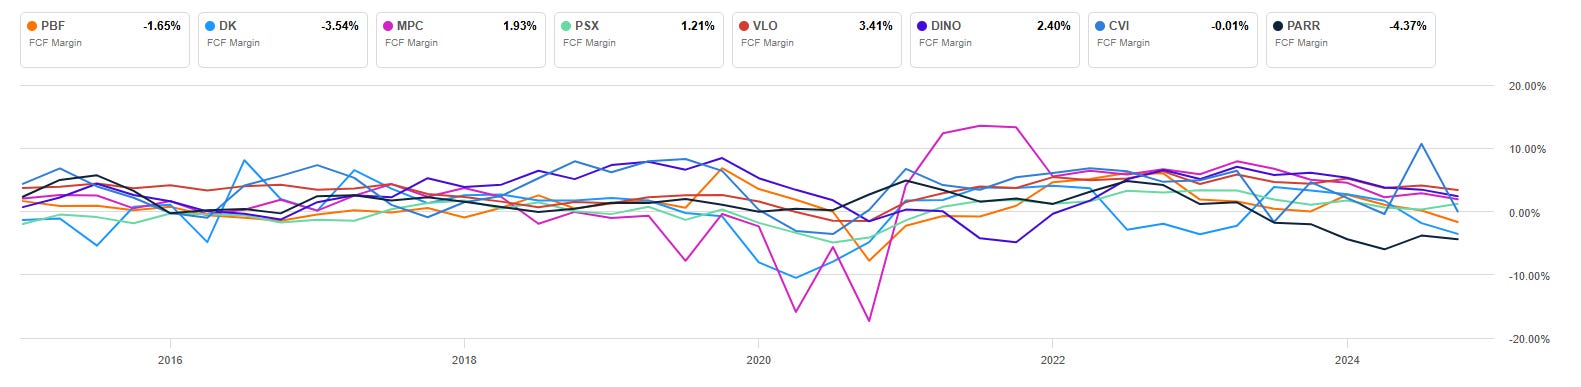
From the FCF chart above, Valero again stands out with the highest average FCF margin around 3.4%. This is an impressive achievement for a refiner, indicating that Valero consistently converted a portion of its sales into free cash despite heavy capex needs. It points to disciplined capital spending and strong operating cash flows. HF Sinclair posts the second-highest FCF margin (2.4% on average) – likely because it historically kept capital spending relatively modest (HollyFrontier was known for capital discipline and even “under-investing” in growth, focusing on dividends). HF Sinclair also received a cash infusion from selling some assets (e.g. asphalt terminals in 2017) which may have boosted certain years’ FCF. Marathon shows a solid FCF margin (1.9% average), which is notable given Marathon undertook huge capex (Andeavor integration, refinery upgrades) in late 2010s and then returned massive cash via buybacks (though buybacks don’t reduce FCF as they are financing cash flows). Marathon’s FCF margin being a bit lower than Valero’s is due to its larger capital expenditures and working capital swings around the Speedway sale.
Phillips 66’s FCF margin is about 1.2%, reflecting moderate free cash generation. PSX invested heavily in projects (which kept FCF down) but still managed positive FCF courtesy of its midstream cash flows and asset sales (like selling pipelines to its MLP earlier). Notably, PSX kept raising its dividend throughout, so it was generating enough FCF to do so, but its margin is clearly below VLO/MPC – reinforcing that PSX’s refining + growth spending soaked up a lot of cash.
On the weak end, Par Pacific and Delek show negative average FCF margins (~–4.4% for Par, –3.5% for Delek). These two have consistently spent more cash than they brought in from operations. For Par, frequent acquisitions (spending cash on purchases, as well as high operating costs) and lack of any dividend means cash was plowed back or drained – indeed Par often had to raise debt/equity to fund purchases. The negative FCF margin confirms the concerns: Par’s management “too often see large stock repurchases eventually put companies in trouble” – effectively Par was spending cash on buybacks and acquisitions without generating enough internally. Delek’s negative FCF likely stems from heavy capex (it spent on refinery upgrades and supporting the MLP drop-downs) plus RIN costs and not having strong operating cash in weak margin years. Delek’s strategy to unlock value hasn’t yet translated to free cash – it’s still in investment mode (and paying a dividend too, funded partly by logistics cash flows).
PBF Energy’s FCF margin ~–1.7% also is negative on average – PBF had some years of big negative FCF (2020, when it borrowed to sustain operations, and 2018–2019 when it spent on acquisitions and capex), offset by the huge positive FCF of 2022. So over the period it netted slightly negative. PBF’s management historically was willing to operate with thin cash buffers, which backfired in downturns. Only recently did PBF generate positive FCF and start a dividend.
CVR Energy is roughly break-even at –0.01% FCF margin, essentially zero. This implies CVR used almost all operating cash on capex and dividends. In fact, CVR has a policy of paying out large variable dividends in good times (e.g. in 2022 it paid a hefty special dividend), so it doesn’t retain much cash. Additionally, CVR had to invest in the Wynnewood renewables conversion and some big turnarounds, consuming cash.
Overall, the financial comparisons reinforce a categorization:
Capital-efficient, cash-generative leaders (high EBITDA margins, high ROTC, solid FCF) – Marathon and Valero exemplify this, with Phillips 66 trailing as a partial member of this group (good cash generation but with some efficiency issues). These firms can fund growth, maintain strong balance sheets, and still return cash – hence are investor favorites.
Mid-tier or turnaround stories (middling margins, okay or improving FCF) – HF Sinclair, CVR, maybe PSX can be put here. They have acceptable metrics but not best-in-class. HF Sinclair shows respectable FCF margin and decent dividends, but its EBITDA margin and ROTC are lower than leaders due to regional disadvantages. CVR is improving its cash outlook after maintenance – expected to resume dividends by 2026 as free cash flow strengthens. These are companies that can be solid performers if conditions allow, but historically haven’t matched the leaders.
Structurally weaker or volatile players (poor average margins, low/negative ROTC, poor free cash generation) – PBF, Par Pacific, and Delek fall in this bucket. They have spent much of the past cycle underperforming financially, only doing well in brief spurts when cracks are extremely favorable. For instance, PBF’s cumulative free cash over 2015–2022 was around nil, as it all got wiped by the downturn and capex. Par and Delek actually eroded shareholder value via negative cash flows and share price declines. These companies need either a sustained very strong margin environment or major internal changes (cost cuts, asset sales, etc.) to improve their financial metrics to peer averages. Otherwise, investors will view them as risky bets.
🥇 Conslusion - Leaders, High-Upside, and Weak/Volatile Players
Based on the comprehensive analysis of each company’s strategy, financial performance, and competitive position, we can categorize the U.S. refining companies into three groups for a 3–5 year investment outlook:
**🔹 Capital-Efficient and Cash-Generative Leaders:
These are the refiners that combine strong operational performance, high returns on capital, and robust free cash flow generation, making them reliable value creators and shareholder return vehicles.
Marathon Petroleum (MPC): Marathon is a top-tier leader with scale and savvy capital management. It has the best free cash profile (in part due to MPLX cash flows) and a commitment to massive shareholder returns. Marathon reduced its share count dramatically and is positioned to keep delivering high cash yields via dividends and buybacks. Its EBITDA margins are highest-in-class (~6%), and it has shown discipline in not chasing low-return growth. Over a 3–5 year horizon, Marathon appears recession-proof – by 2025–26, MPLX distributions could fully cover Marathon’s capex and dividend, “making it a recession-proof refiner”. Marathon’s strong balance sheet (debt reduction after Speedway sale) and integrated model give it resilience.
Valero Energy (VLO): Valero has consistently outperformed peers in operating margin (leading EBITDA/barrel 9 of last 11 years) and maintains the lowest cost per barrel in the industry. Its superior execution translates to higher ROTC and FCF margins than any rival. Importantly, Valero’s strategy of internal consolidation and fuel yield optimization means it stands to benefit disproportionately from industry capacity reductions – as weaker plants close, Valero picks up volume and margin. It has a proven ability to handle downturns (never posting negative EBITDA in recent history), and it opportunistically returns cash (10%+ shareholder yield in 2024). With a modest growth pipeline (renewable diesel expansion, small debottlenecks) and no burden of an upstream segment, Valero is squarely focused on refining excellence. Over 3–5 years, even if refining margins ebb and flow, Valero is likely to remain at the top of the pack in profitability.
Phillips 66 (PSX): While Phillips 66 has underperformed somewhat, it still belongs among the larger, financially strong refiners. PSX’s refining segment alone isn’t best-in-class (hence activist pressure), but the company’s integrated midstream and chemicals earnings provide stability and cash that support a solid dividend (3.6% yield) and buybacks. The stock currently trades at a discount due to its issues, but that also implies upside if management executes improvements. With Elliott Management pushing for changes (possibly a midstream spin-off or efficiency gains), there is a catalyst for unlocking value in the next 1–2 years. Even without activism, PSX plans to double midstream EBITDA by 2025, which should boost overall cash flow. Phillips 66 generates hefty free cash flow (nearly $5B/year in mid-cycle conditions) and has a commitment to shareholder returns (it targeted $10B of buybacks post-2022).
🔸 Growth-Focused, High Upside Potential Companies:
This category includes refiners that are pursuing growth or transformation strategies (through acquisitions, expansions, or special catalysts) and thus could offer significant upside if successful. They may not be as steady as the leaders, but they have identifiable drivers that could substantially boost earnings or valuation in coming years.
HF Sinclair (DINO): HF Sinclair has grown via the Sinclair merger and is now leveraging that integration. It’s somewhat of a hybrid: a refiner + marketer + specialty producer, which gives it multiple avenues for growth. Its upside potential comes from synergy realization (improving efficiency across its expanded system) and expanding its Sinclair gasoline retail brand – a tactic that could increase captive sales and margins over time. Additionally, HF Sinclair’s investments in renewable diesel (three units operational) position it to capitalize on the growing demand for low-carbon fuels without huge further capex. In the next few years, if inland crude discounts widen again (e.g. due to Canadian supply growth), HF Sinclair stands to gain margin – the analysis noted risks like TMX pipeline reducing discounts, but if oil dynamics shift (say Canadian supply outpaces takeaway, or a potential U.S. tariff on imports ironically could improve margins for domestic refineries if it tightens product supply), HF Sinclair could surprise to the upside.
Delek US (DK): Delek is a smaller refiner but one with a clear near-term upside catalyst: potential regulatory relief on RFS obligations. Delek’s refining business has been weighed down by hefty RIN costs (up to $150M/year). Now, due to a court win, EPA may grant Delek retroactive and/or future small refinery exemptions. If Delek secures even part of the retroactive exemptions, it could receive a significant one-time cash windfall (potentially hundreds of millions) and ongoing annual savings. This would directly and meaningfully boost its refining EBITDA and FCF (management noted that even forward-only exemptions “would mean a big jump in profits... given how little of that business is priced into DK stock”). However, if RFS policy disappoints, Delek remains a sub-scale refiner with thin margins, so it’s a bit binary.
CVR Energy (CVI): CVR is not traditionally “growth-focused” in the sense of expansion, but it presents high upside through a turnaround and special situation angle. After suspending dividends due to a big turnaround, CVR is poised to resume hefty payouts by early 2026 as cash flow improves. Furthermore, CVR’s stake in CVR Partners (fertilizer) is a hidden asset; if fertilizer markets strengthen (or if CVR were to monetize that stake), it could unlock value.
🔻 Structurally Weak or Volatile Players to Avoid:
This group consists of companies that, for various structural reasons, exhibit higher risk, inconsistent performance, or fundamental weaknesses that make them less attractive for a medium-term investment. They may perform well during industry peaks but are prone to steep downturns, and their strategic outlook is uncertain or negative. Investors should approach these with caution or avoid them, barring a speculative short-term trade.
PBF Energy (PBF): While PBF benefited hugely from 2022’s spike, it remains a highly volatile, margin-sensitive refiner with no cushion. Its average EBITDA and FCF margins over time are among the worst in the peer group, meaning over a cycle it barely makes money. PBF’s business is essentially a pure bet on crack spreads staying high. However, as we saw in late 2024/early 2025, when spreads fell, PBF quickly slid back into losses. It has no retail or midstream integration, so it’s at the mercy of commodity markets. Additionally, it carries some region-specific risks: a significant portion of its capacity is in California (Martinez, Torrance) where environmental rules are tightening and PBF had an unfortunate refinery fire that underscored operational risks. The company did strengthen its balance sheet with 2022 profits, but it also diluted shareholders via an equity raise (indicating its vulnerability).
Par Pacific Holdings (PARR): Par Pacific appears to have the most structural weaknesses among peers: very high operating costs, heavy debt, and exposure to small, isolated markets. Its own management decisions have been questionable – the company is buying back stock despite sub-investment-grade debt and only just returned to (slight) profitability. Par’s EBITDA margins are consistently low (averaging under 2%) and it has posted net losses in multiple quarters (e.g. a GAAP loss in Q1 2024). The recent Billings refinery acquisition, while boosting capacity, brought an “old inefficient refinery” with very high costs that diluted overall margin. In fact, Billings has required heavy maintenance, and Par warned it will have negative impact in Q2 2024 due to turnaround downtime. Fundamentally, Par is also geographically disadvantaged: its Hawaii business depends on tourism (volatile demand) and faces long-term decline risk from Hawaii’s aggressive renewable energy goals; its Washington refinery competes in an oversupplied West Coast market and its state has among the highest EV adoption (11% of sales) which threatens gasoline demand; its mainland refineries are very small scale.